
FIGURE 4.
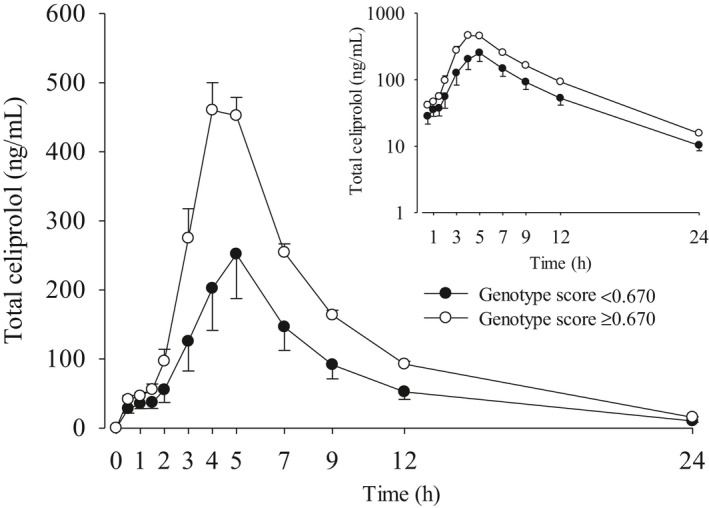
Geometric mean (90% CI) LBW‐adjusted plasma concentrations of celiprolol after a single 200 mg oral dose of celiprolol in 195 healthy volunteers with different combinations of SLCO1A2 c.516A>C and ABCB1 haplotypes. The inset depicts the same data on a semilogarithmic scale. The volunteers were grouped according to the genotype score (GS) limit 0.670: GS < 0.670 (n = 27) and GS ≥ 0.670 (n = 168). CI, confidence interval; LBW, lean body weight