FIGURE 4.

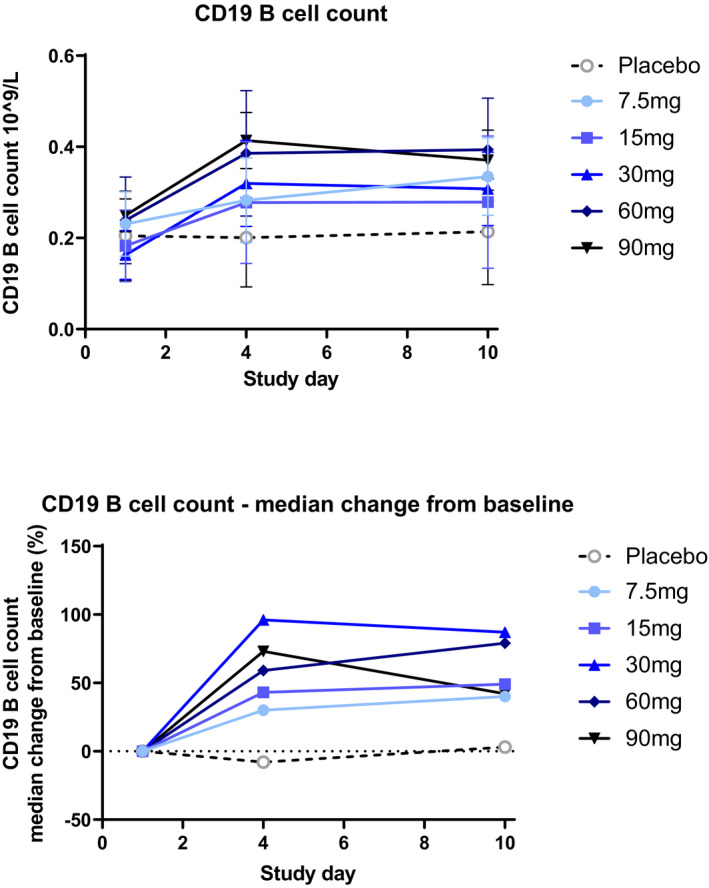
Changes in CD19 B cell counts by dose during MAD (part B). Numbers of CD19+ B cells were measured predose on days 1, 4, and 10 by flow cytometry in part B only. Notes: Error bars represent the SD. MAD, multiple ascending dose

Changes in CD19 B cell counts by dose during MAD (part B). Numbers of CD19+ B cells were measured predose on days 1, 4, and 10 by flow cytometry in part B only. Notes: Error bars represent the SD. MAD, multiple ascending dose