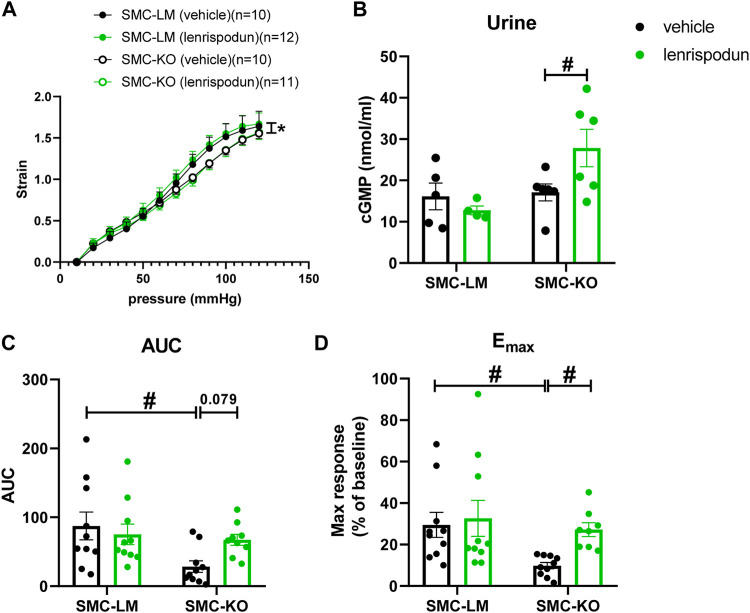
FIGURE 3.
The ex vivo stiffness (A) in carotid artery segments of SMC-KO mice versus their SMC-LM. Lenrispodun-treated samples are shown in green. Compliance was measured by pressure myography technique and plotted as intraluminal pressure vs. strain. The cGMP content (B) in the urine of SMC-KO mice versus their SMC-LM, lenrispodun-treated samples are shown in green. In vivo cutaneous microvascular reactive hyperemia in SMC-KO mice versus their SMC-LM measured with Laser Doppler, expressed as (C) area under the curve (AUC) and (D) maximum response (Emax); *, p < 0.05, GLM for repeated measures; #, p < 0.05, two-way ANOVA followed by Bonferroni’s post hoc test.

