
FIGURE 3.
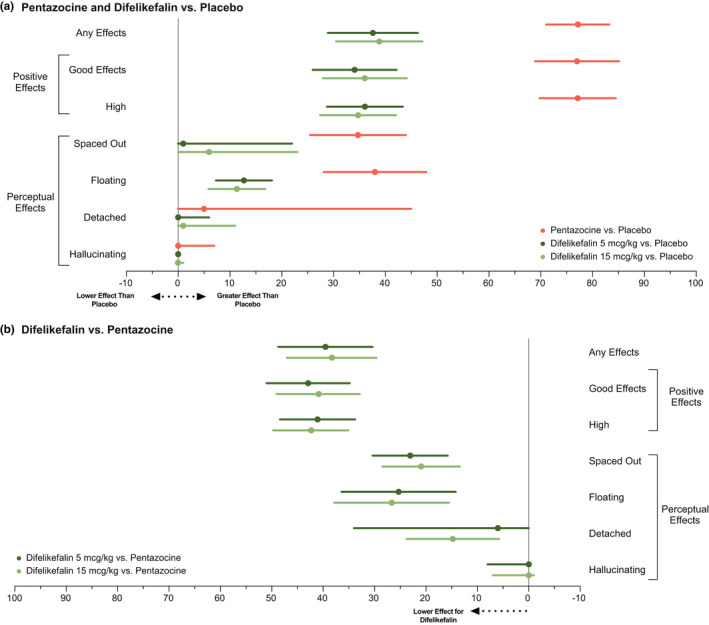
Differences in drug effects questionnaire (DEQ) VAS scores for pentazocine and difelikefalin treatment relative to placebo (a) and for pentazocine treatment relative to difelikefalin (b) for any effects, positive effects, and perceptual effects. Data represent the central value of treatment differences analysis in peak effect (Emax) with lower/upper limit for selected VAS item of the Drug Effects Questionnaire (completer set, N = 39). Depending on the test statistic used to compare treatment groups, the central value represented in the plots is either the mean or the median and the limits are either the upper/lower value of the 90% CI around the mean or the first and third quartile of the distribution. CI, confidence interval; VAS, visual analog scale