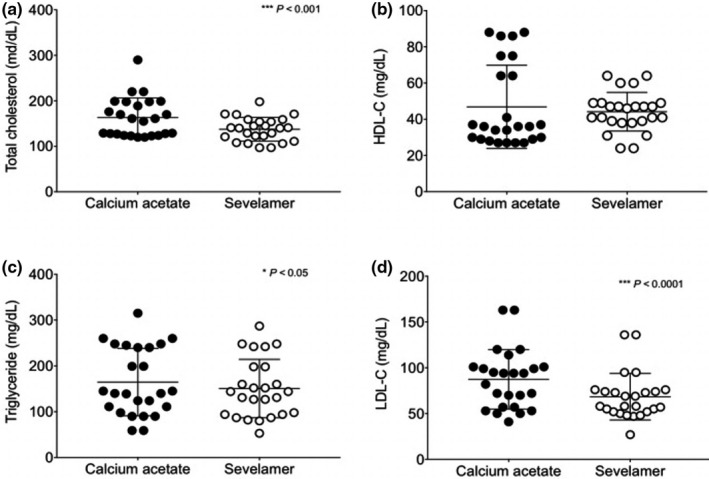
FIGURE 2.

Changes in serum lipids after 12 weeks of treatment with sevelamer carbonate and calcium acetate. (a) Total cholesterol (TC), (b) high‐density‐lipoprotein cholesterol (HDL‐C), (c) triglycerides (TG), (d) low‐density lipoprotein cholesterol (LDL‐C). Mean ± SD *p < 0.05, ***p < 0.001
