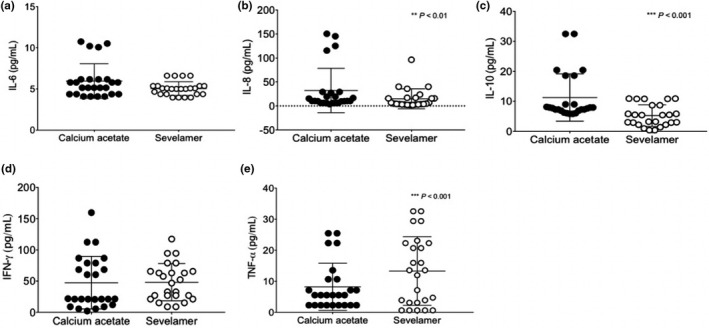
FIGURE 3.

Changes in serum inflammatory markers after 12 weeks of treatment with sevelamer carbonate and calcium acetate. (a) Interleukin‐6, (b) Interleukin‐8, (c) Interleukin‐10, (d) IFN‐γ, (e) TNF‐α. Values expressed as mean ± SD **p < 0.01, ***p < 0.001
