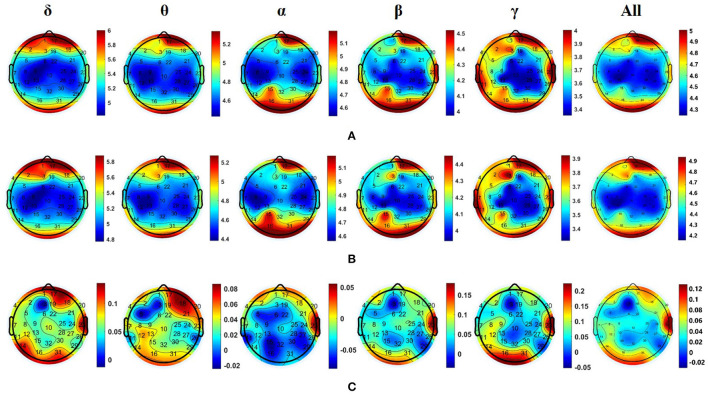
Figure 4.
Averaged DE distributions of all nine subjects in the five frequency bands induced by personal preferred music (A) and neutral music (B), and their DE difference distribution [i.e., personal preference minus neutral music, as shown in (C)] in the five frequency bands. Where δ: 0.5–3 Hz; θ: 4–7 Hz; α: 8–13 Hz; β: 14–30 Hz; γ: 30–50 Hz; All (0.5–50 Hz).

