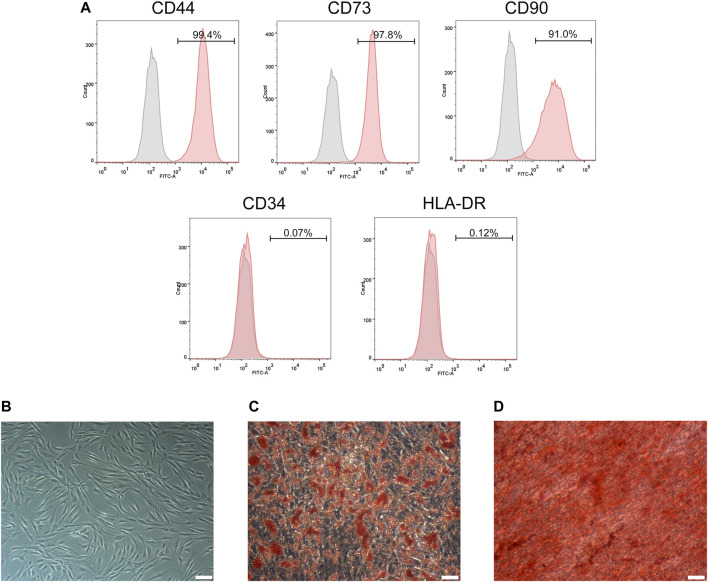
FIGURE 1.
Identification of ADSCs. (A) Flow cytometry analysis showed that ADSCs were positive for CD44, CD73 and CD90 but negative for CD34 and HLA-DR. (B) The morphology of ADSCs. (C) Adipogenic potentials of ADSCs (oil red O staining). (D) Osteogenic potentials of ADSCs (alizarin red staining). (A,C,D) Scale bars: 100 mm.

