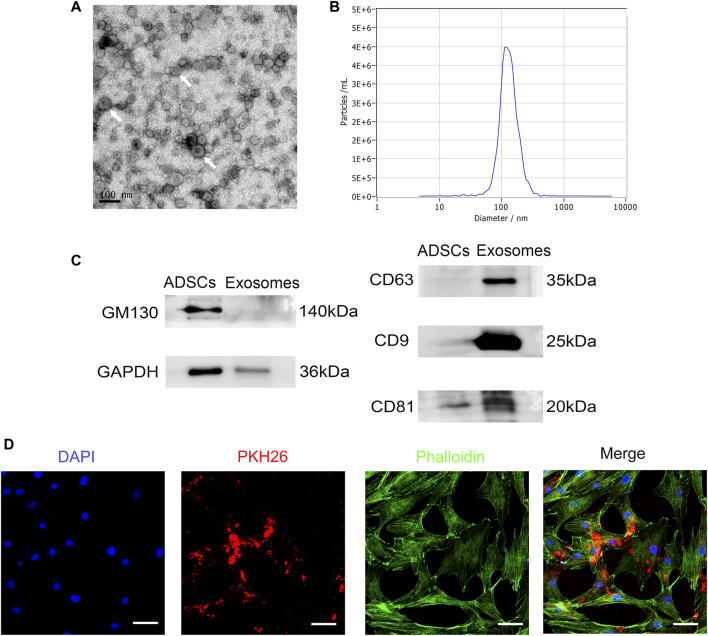
FIGURE 2.
Identification and internalization of RSC96-Exos. (A) Morphology of RSC96-Exos observed by transmission electron microscopy. Scale bar: 100 nm. White arrows indicate the RSC96-Exos. (B) Measurement of the RSC96-Exos population by nanoparticle tracking analysis demonstrated a single-peaked pattern (127.5 ± 2.1 nm in diameter). (C) Western blot analysis of total protein markers (GM130 and GAPDH) and exosome surface markers (CD63, CD9 and CD81) in ADSCs and RSC96-Exos. (D) Confocal images of ADSCs incubated with 20 μg PKH26-labeled RSC96-Exos for 24 h. Scale bar: 50 µm.

