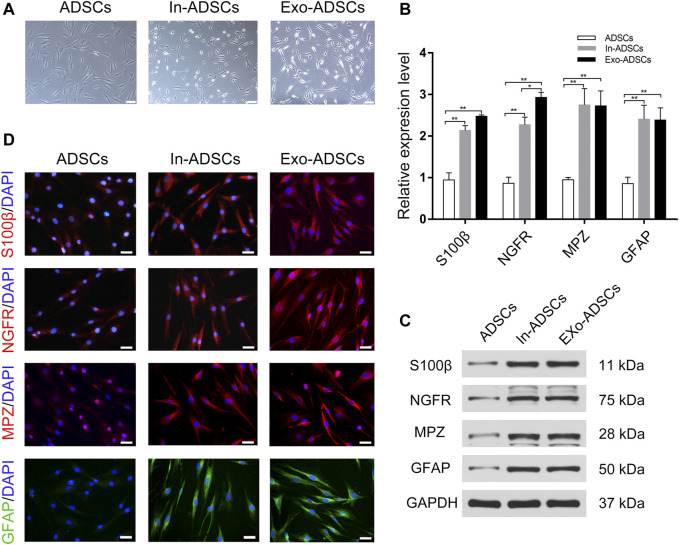
FIGURE 3.
Phenotypic characteristics of In-ADSCs and Exo-ADSCs. (A) Images of ADSCs, In-ADSCs, and Exo-ADSCs taken under a phase-contrast microscope. Scale bar: 100 µm. (B) RT-qPCR analysis showing the mRNA levels of S100ß, NGFR, MPZ and GFAP in ADSCs, In-ADSCs, and Exo-ADSCs. (C) Western blot analysis showing the protein levels of S100ß, NGFR, MPZ and GFAP in ADSCs, In-ADSCs, and Exo-ADSCs. (D) Fluorescence microscopy showing the immunoreactivity of S100ß, NGFR, MPZ and GFAP in ADSCs, In-ADSCs, and Exo-ADSCs. Scale bar: 50 µm. The data was presented as the mean ± SD (n = 3 independent experiments). *p < 0.05, **p < 0.01.

