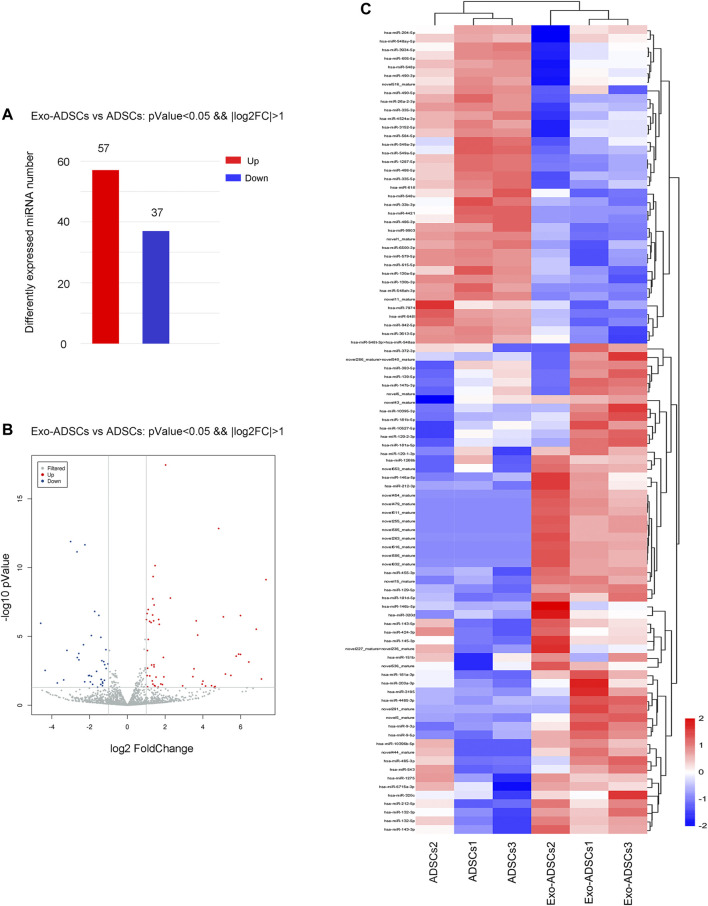
FIGURE 4.
The miRNA expression profile of Exo-ADSCs. (A) The number of aberrantly expressed miRNAs with up- or downregulation. (B) Volcano map showing the distribution of differentially expressed miRNAs. Red dots, significantly upregulated genes. Blue dots, significantly downregulated genes. Gray dots, nondifferentially expressed genes. (C) Heat map showing the dominant cluster pattern of miRNAs. Red signals and blue signals represent upregulated and downregulated expression, respectively.

