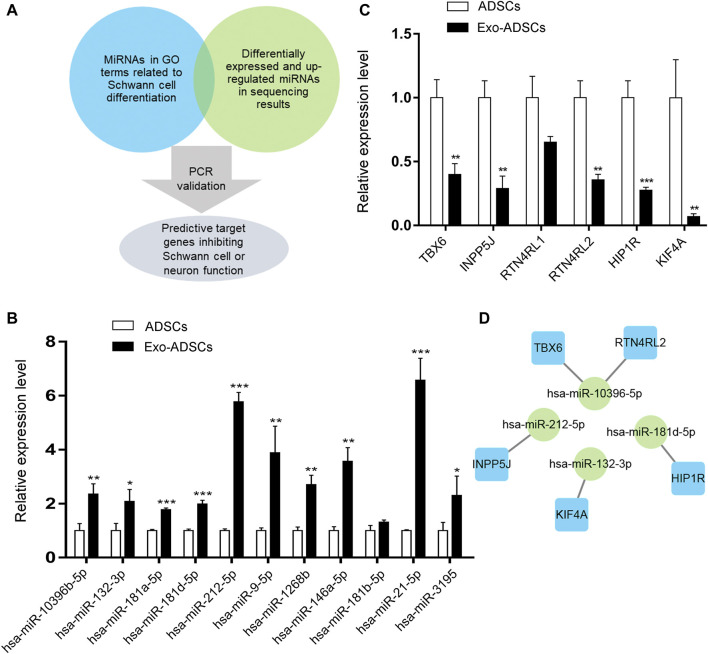
FIGURE 6.
MiRNAs and target genes validation. (A) Mind map for miRNAs and target genes screening. (B) RT-qPCR analysis to validate the expression of the selected miRNAs in ADSCs and Exo-ADSCs. (C) RT-qPCR analysis to validate the expression of the selected target genes in ADSCs and Exo-ADSCs. (D) The miRNA-gene-network based on the validated miRNAs and their target mRNAs. Green circular nodes represent the validated miRNAs, whose target mRNAs were validated by RT-qPCR. Blue square nodes represent their validated target mRNAs. The results were presented as the mean ± SD (n = 3 independent experiments). *p < 0.05, **p < 0.01, ***p < 0.001.

