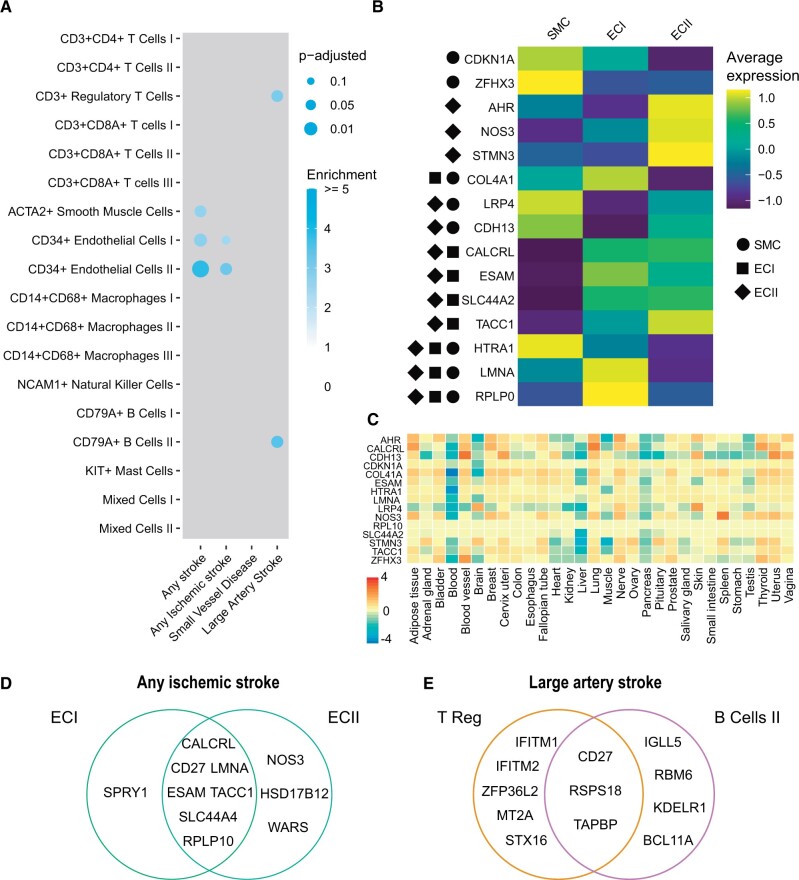
Figure 3.
Genome-wide association studies related to stroke show substrate in endothelial cells. (A) Plot representing overlaps of genome-wide association studies candidate genes on stroke with genes specifically expressed in cell populations from human atherosclerotic plaque. Colour intensity indicates enrichment over random data and size indicates adjusted P-value (Benjamini–Hochberg). (B) Heatmap depicting expression of genes from any stroke from A in the respective cell populations. Only significant overlaps are plotted, symbols represent the cell populations with the significant overlaps. (C) Average of normalized expression (zero mean across samples) of genes from any stroke in from B in 30 tissues from GTEx. (D) Genes for any ischaemic stroke underlying the overlaps in ECI and ECII populations. Only significant overlaps are plotted. (E) Genes for large artery stroke underlying the overlaps in T Reg and B cells II populations. Only significant overlaps are plotted.

