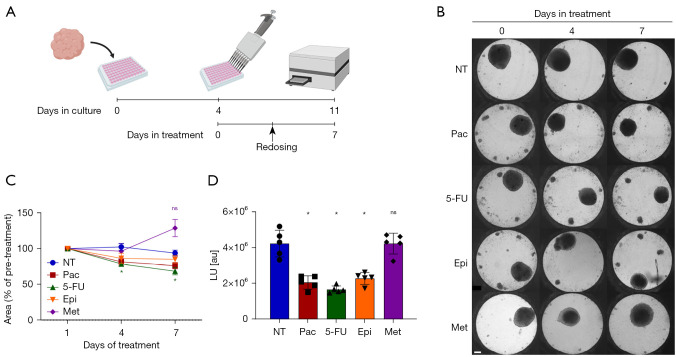
Figure 5.
Drug panel reveals differences in response of breast cancer spheroids to multiple chemotherapeutic agents. (A) Schematic representation of experimental framework and timeline (created with BioRender.com). (B) Phase contrast images track morphological changes of spheroids generated from human breast cancer samples (patient ID #16, ER+, PR+, HER2−, luminal A) upon a 7-day treatment in InSphero 3D InSightTM plates. Drug treatment included 100 nM Pac, 50 µg/mL 5-FU, 1 µM Epi or 20 mM Met and was applied 4 days after cell seeding, in 5 replicates per treatment. Redosing was performed after 3 days. Scale bar: 100 µm. (C) Size of tumor spheroids significantly decreases in response to 5-FU treatment. Data is presented as a percent of size on day 1 of treatment (n=5, asterisks indicate statistically significant differences from the NT; *, P<0.05; analyzed using two-way ANOVA, followed by Dunnett’s test). Mean values with SEM are shown. (D) Viability of the spheroids was determined after 7 days of treatment using a luminescence-based ATP assay. The average of absolute luminescence from 5 replicates is shown in the graph, with standard error. ATP levels significantly decreased under treatment with the chemotherapy drugs for breast cancer, Pac, 5-FU, and Epi, while Met showed no reduction in ATP levels (n=5, asterisks indicate statistically significant differences from the NT; *, P<0.0001; analyzed using two-way ANOVA, followed by Dunnett’s test). Mean values with SEM are shown. Pac, paclitaxel; 5-FU, 5-fluorouracil; Epi, epirubicin; Met, metformin.

