Fig. 1.
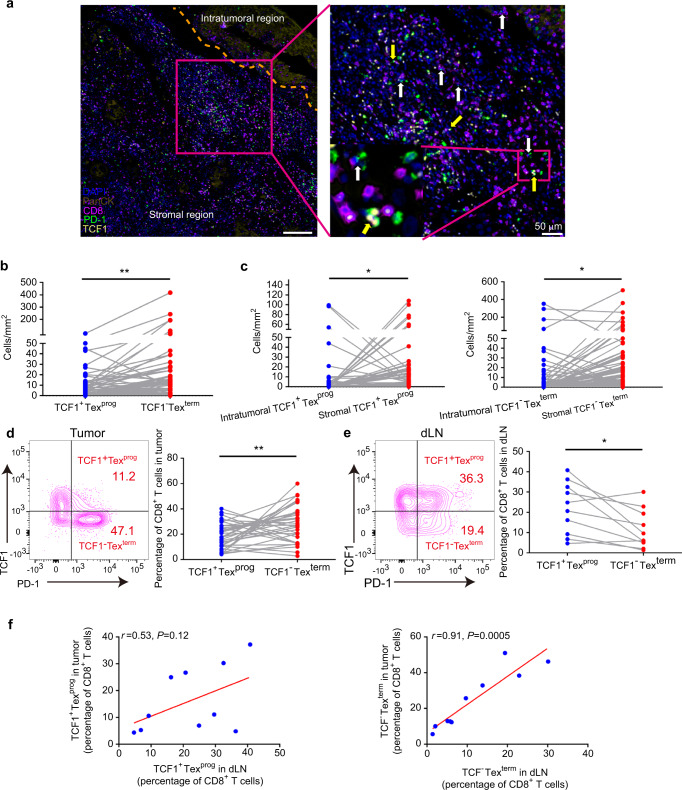
CD8+PD-1+TCF1+ progenitor exhausted T cells (TCF1+Texprog) and CD8+PD-1+TCF1− terminally exhausted T cells (TCF1−Texterm) in the head and neck squamous cell carcinoma (HNSCC) microenvironment. a Representative images of HNSCC multiplex immunohistochemistry (mIHC) slides showing CD8+PD-1+TCF1+ Texprog (yellow arrow) and CD8+PD-1+TCF1−Texterm (white arrow) cells. b Quantitative analysis revealed that the density of TCF1−Texterm cells was higher than that of TCF1+Texprog in the whole tumoral region (n = 102). c Quantitative analysis revealed that progenitor and terminally exhausted T cells were more abundant in the stromal region (n = 102). d Representative contour plots of TCF1+Texprog and TCF1−Texterm in tumor by flow cytometry and quantitative analysis showed that TCF1−Texterm were more abundant than TCF1+Texprog in tumors (n = 34). e Representative contour plots of TCF1+Texprog and TCF1−Texterm in draining lymph nodes (dLNs) by flow cytometry and quantitative analysis showed that TCF1+Texprog were more abundant than TCF1−Texterm in dLNs (n = 10). f Flow cytometry results showed that TCF1−Texterm in dLNs was positively associated with TCF1−Texterm in tumors, while there was no correlation for TCF1+Texprog (n = 10). Paired t tests were performed for the data in (b–e). Spearman’s correlation test for (f). *P < 0.05, **P < 0.01. Scale bars: 200 μm for left (a) and 50 μm for right (a)

