Fig. 3.
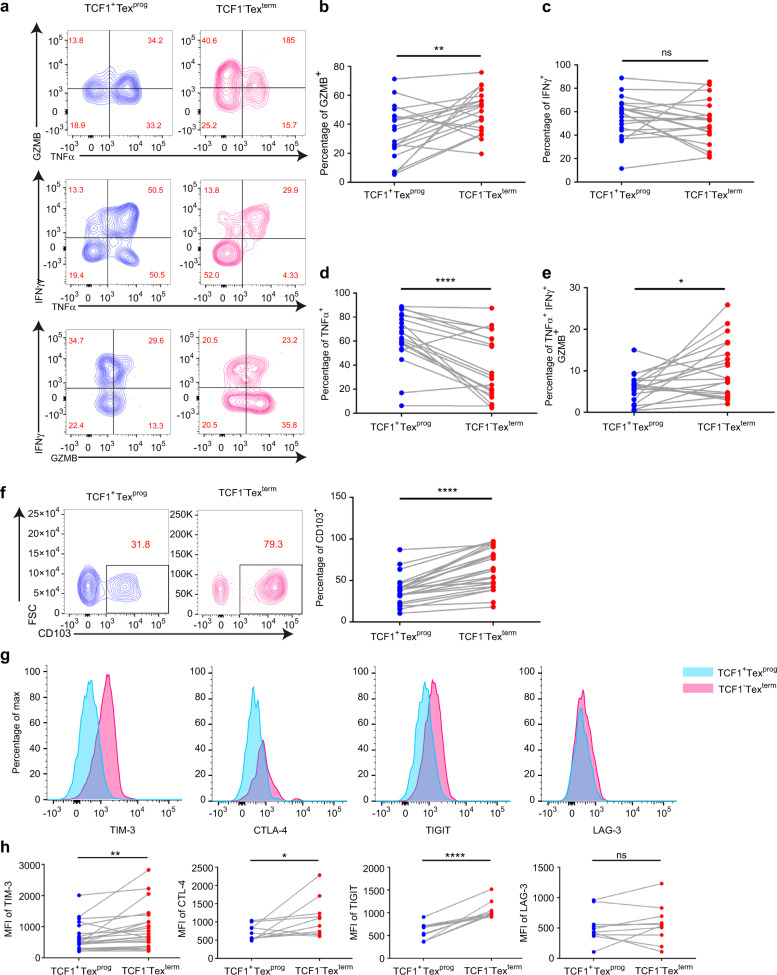
Differences in cytotoxicity activation molecules and cell surface marker expression between CD8+PD-1+TCF1+ progenitor exhausted T cells (TCF1+Texprog) and CD8+PD-1+TCF1− terminally exhausted T cells (TCF1−Texterm) in head and neck squamous cell carcinoma (HNSCC) tumor tissues were detected using flow cytometry. a Representative contour plots of selected cytokine markers (TNFα, GZMB, and IFNγ) gated on TCF1+Texprog or TCF1−Texterm. b TCF1−Texterm showed higher GZMB production (n = 20). c There was no significant difference in IFNγ expression between these two subsets of exhausted T cells (n = 20). d TCF1+Texprog showed a higher TNFα production (n = 20). e TCF1−Texterm displayed a higher proportion of cells with the polyfunctional phenotype of TNFα+GZMB+IFNγ+ (n = 20). f Representative contour plots of CD103 and comparison of CD103 expression among TCF1+Texprog and TCF1−Texterm (n = 24). g Mean fluorescence intensity (MFI) of TIM-3, CTLA-4, TIGIT, and LAG-3 gated on TCF1+Texprog or TCF1−Texterm. h Quantitative analysis of TIM-3 (n = 24), CTLA-4 (n = 10), TIGIT (n = 10), and LAG-3 (n = 10) MFI between TCF1+Texprog and TCF1−Texterm. Paired t tests were performed for (b–f and h). *P < 0.05, **P < 0.01, ****P < 0.000 1, nsP > 0.05

