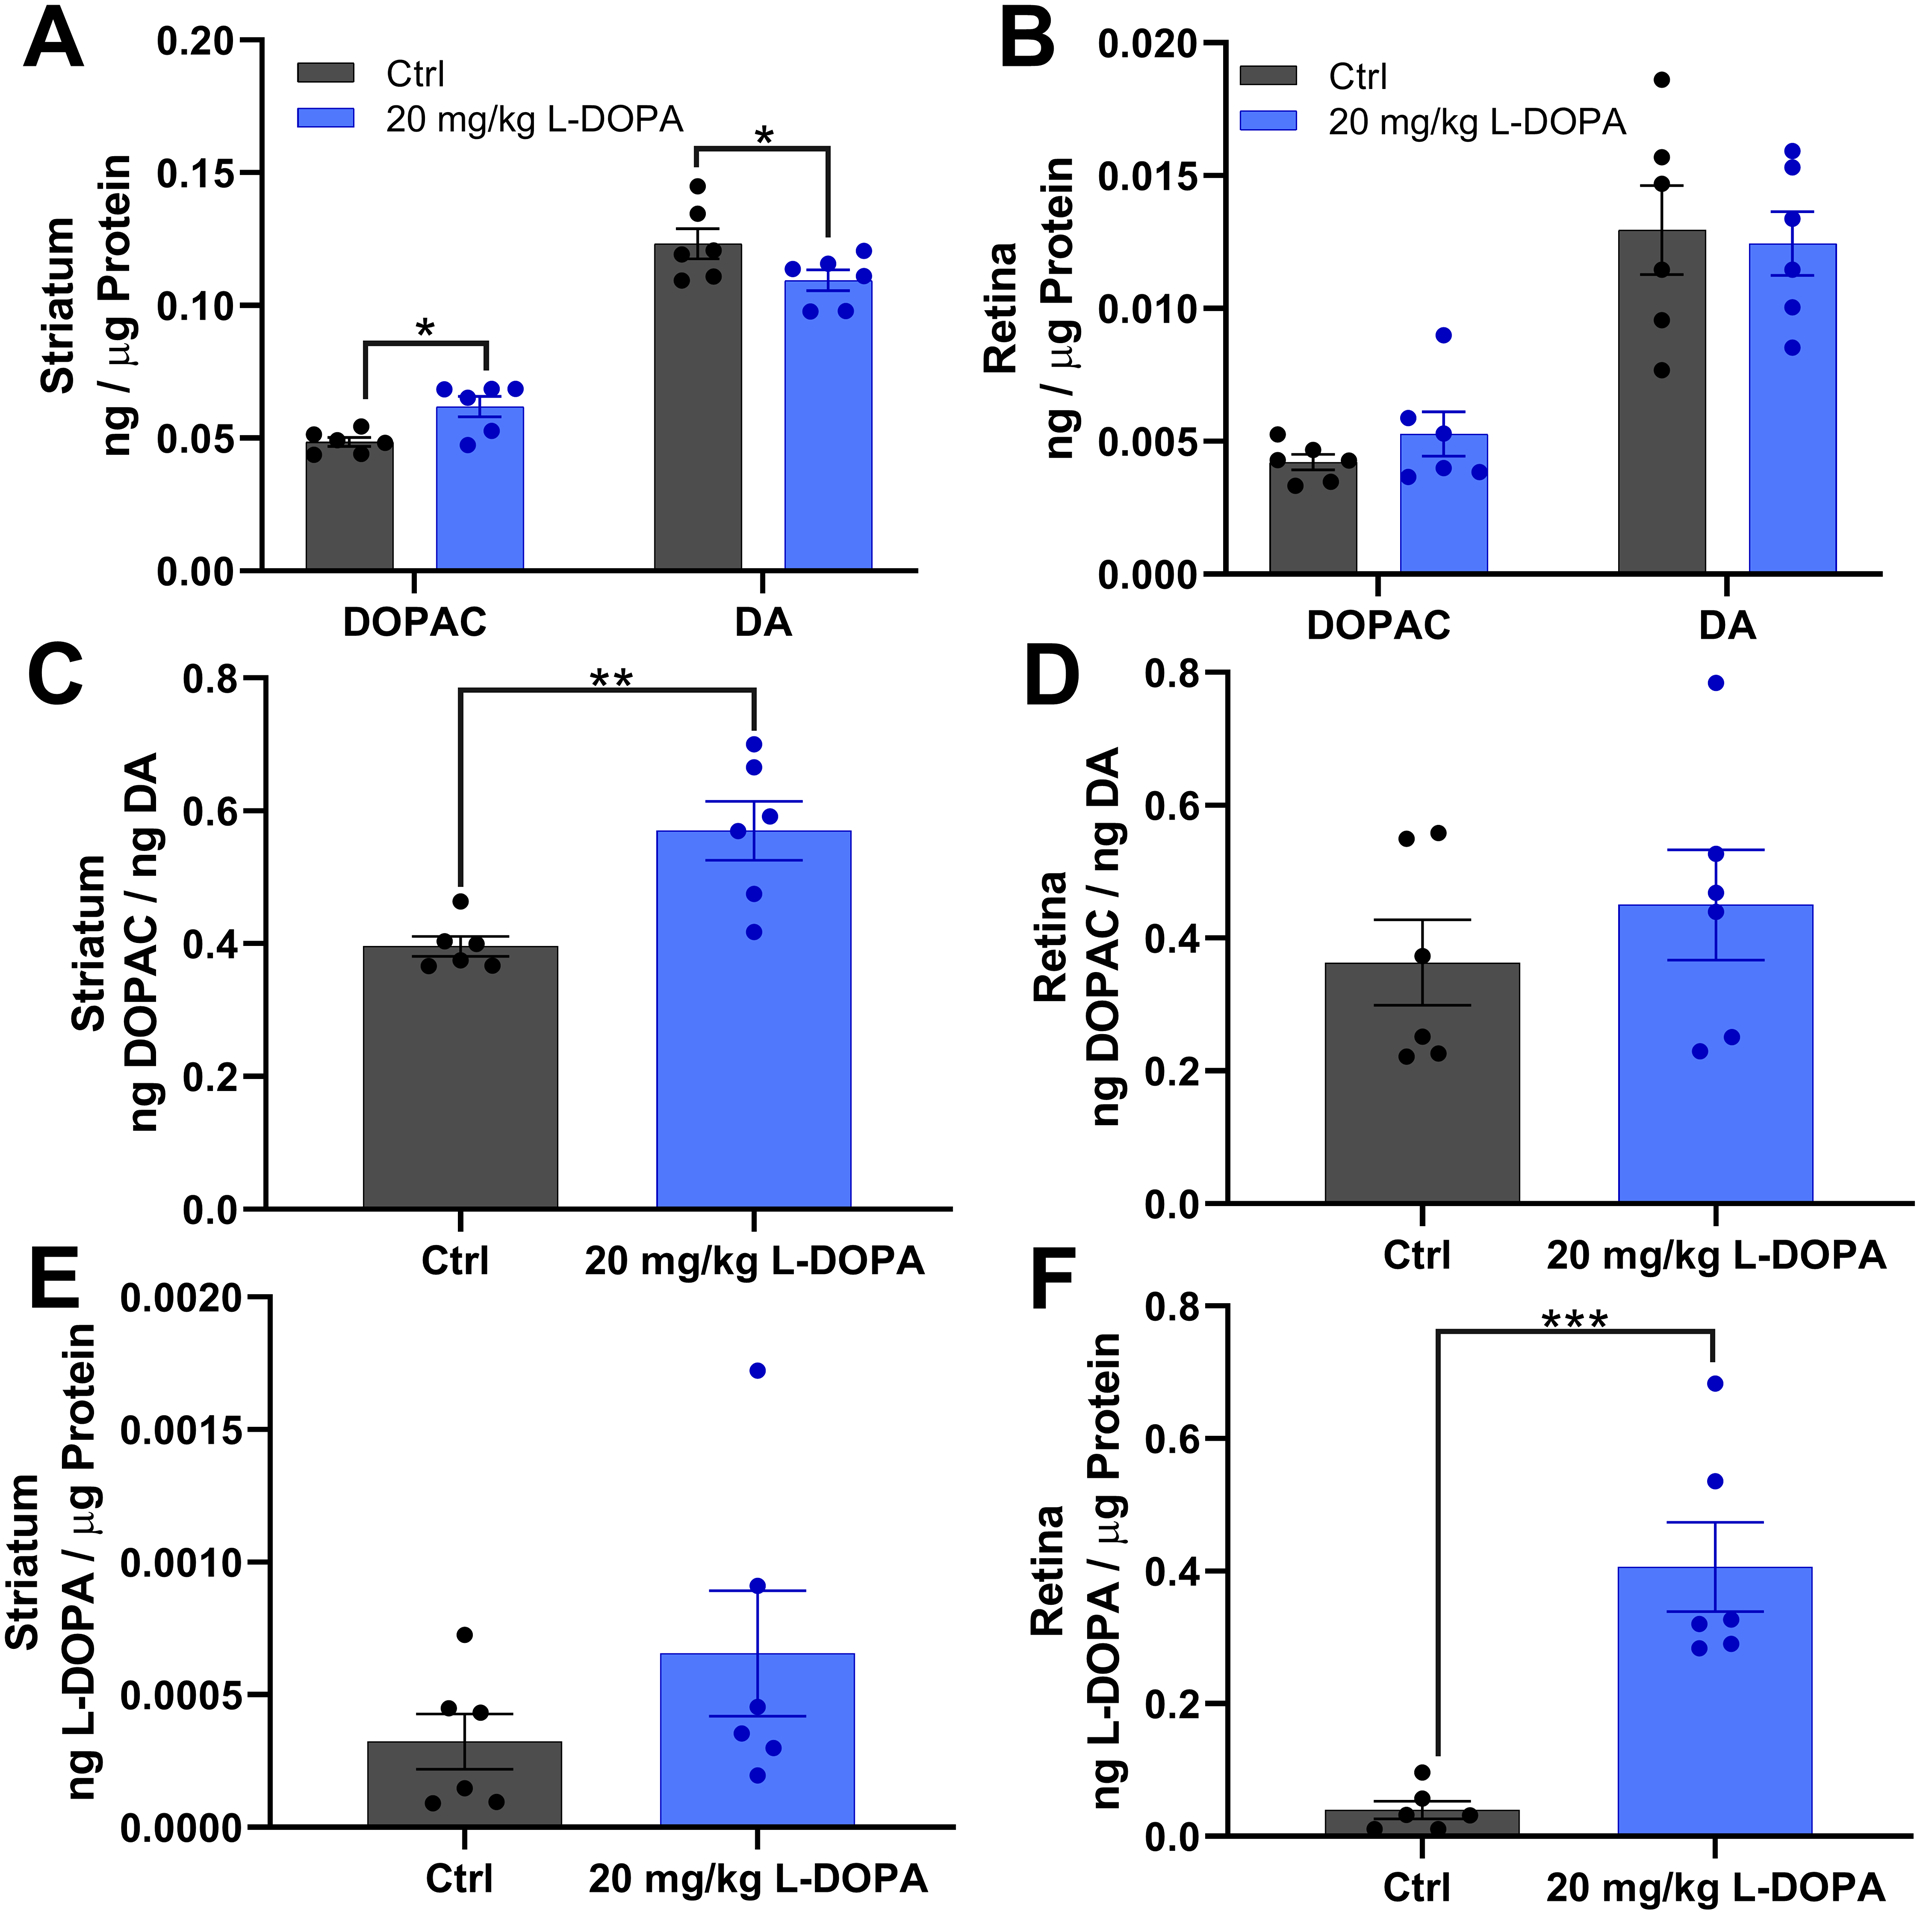
Figure 3:

(A, B) Show dopamine (DA) and its metabolite DOPAC levels in the striatum and retina respectively. (C, D) shows the DOPAC/DA ratio, a metric for dopamine turnover, in the striatum and retina respectively. (E, F) show L-DOPA levels in the striatum and retina respectively. Striatum from rats treated with L-DOPA show significantly increased DOPAC (t(20) = 2.342, p = 0.030, t-test), significantly decreased dopamine (t(20) = 2.424, p = 0.025, t-test), and significantly increased DOPAC/DA ratio compared to controls (t(10) = 3.719, p = 0.004, t-test). Retinas from rats treated with L-DOPA (n=6) show significantly increased L-DOPA compared to controls (n=6; t(10) = 5.352, p < 0.001, t-test).
