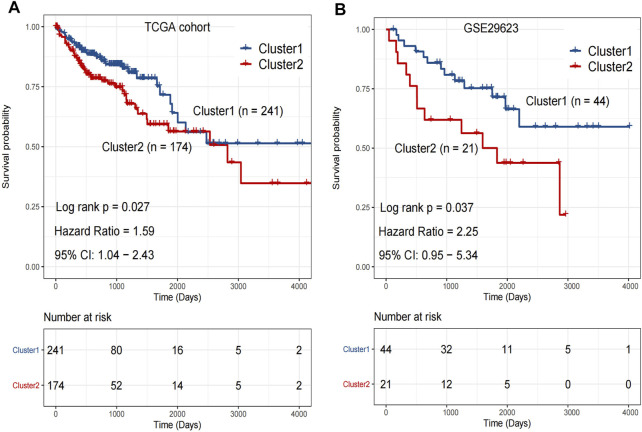
FIGURE 3.
(A) The overall survival rate of Cluster 1 was significantly longer than that of Cluster 2 in TCGA. p < 0.05. (B) The overall survival rate of Cluster 1 was significantly longer than that of Cluster 2 in GSE29623. p < 0.05. Analyzed using unpaired t-test.

