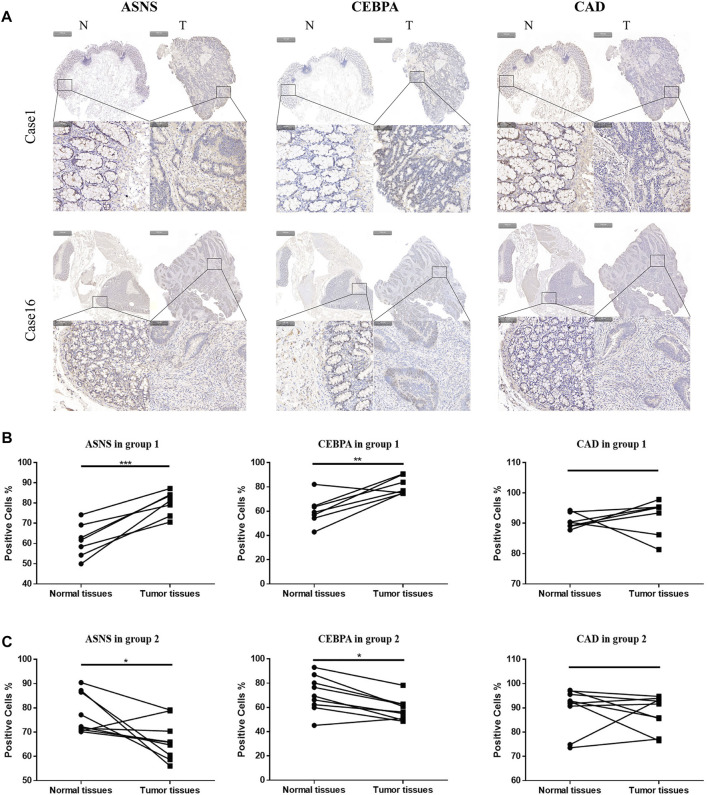
FIGURE 4.
(A)Typical images of IHC in 16 pairs of colon cancer tissues showing the protein expression of ASNS, CEBPA and CAD in colon cancer tissues and adjacent nontumor tissues. Up panel, scale bar 1000 µm; down panel, scale bar 100 µm. (B) Immunohistochemical positive cell rates of ASNs, CEBPA, and CAD in 7 colon cancer tissues and adjacent nontumor tissues in group 1. (C) Immunohistochemical positive cell rates of ASNS, CEBPA and CAD in 9 colon cancer tissues and adjacent nontumor tissues in group 2. *p < 0.05, **p < 0.01 and ***p < 0.001, analyzed using unpaired t-test. Group 1, n = 7; Group 2, n = 9.

