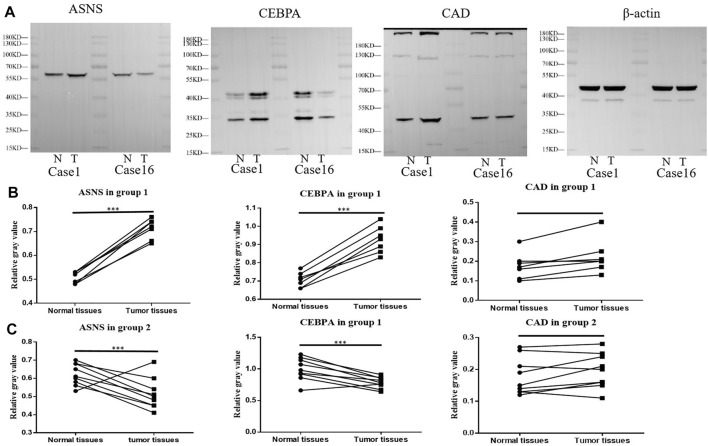
FIGURE 5.
(A) ASNS, CEBPA, and CAD expression levels in Case 1 and Case 16 of tumor specimens and adjacent normal specimens. (B) The relative gray values of western blot, which represent the relative protein expression level, of ASNS, CEBPA, and CAD in 7 Colon cancer tissues and adjacent nontumor tissues in (B) Group 1 and (C) Group 2.*p < 0.05, **p < 0.01 and ***p < 0.001, analyzed using unpaired t-test. Group 1, n = 7; Group 2, n = 9.

