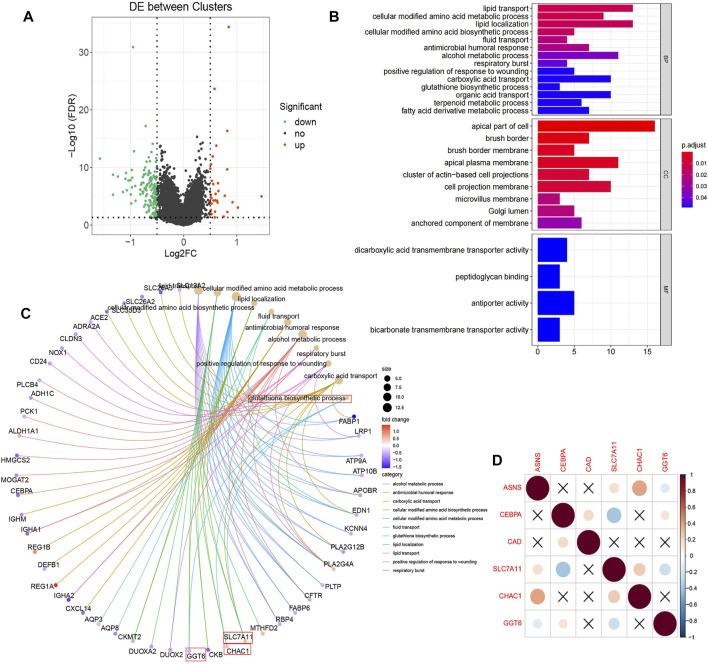
FIGURE 6.
(A) Volcano plot displayed the 157 differentially expressed genes of Cluster 2 screened relative to Cluster 1 with 26 up-regulated (red dots) and 131 down-regulated (green dots).The black dots indicate genes that are not significantly different. (B) The enriched GO BP, CC, and MF terms of the differential genes. (C) The GO entry network diagram, showing the top 11 network relationships of GO enrichment. The process of glutathione synthesis and the genes it contains are indicated with red boxes. (D) Correlation diagram of the prognostic genes and glutathione synthesis process enriched genes.

