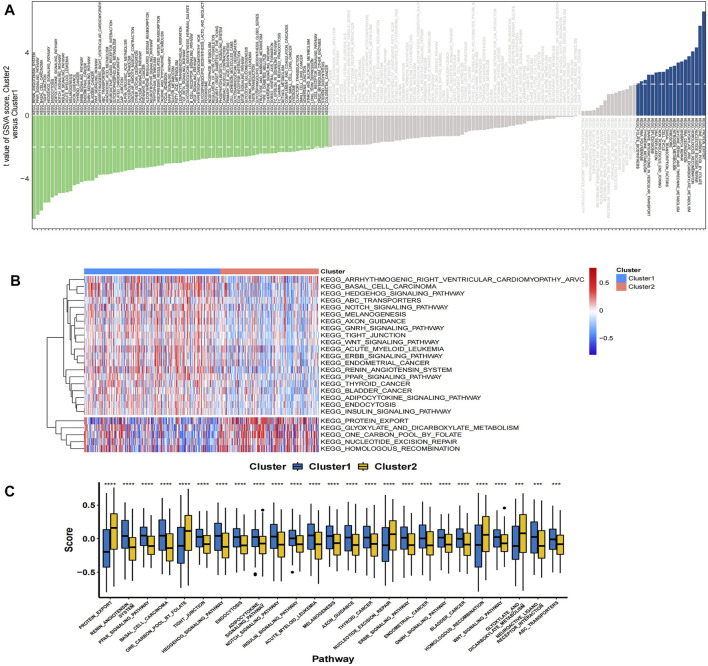
FIGURE 7.
(A) The bar plots show the results of GSVA in the TCGA cohort. A negative t-value means that the pathway is enriched in Cluster 1, and a positive t-value means that it is enriched in Cluster 2. (B) The cluster heat map of the top 25 enriched KEGG pathways. (C) The boxplot showed different activation levels of GSVA-enriched KEGG pathways in Clusters 1 and 2. *** p < 0.001, and **** p < 0.0001. Analyzed using unpaired t-test.

