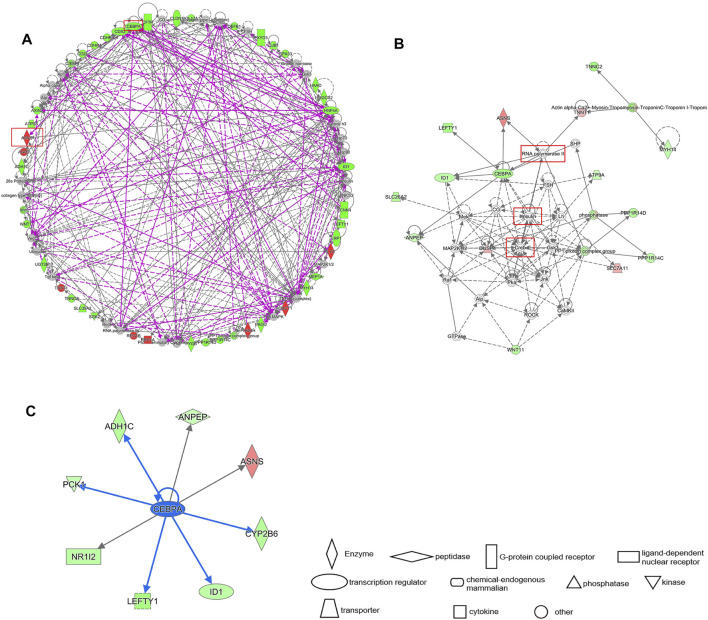
FIGURE 8.
(A) IPA gene interaction network prediction diagram of differential genes. The prognostic genes ASNS and CEBPA are circled in red. Red represents up regulation and green represents down regulation. (B) The local interaction pathway diagram predicted by the IPA interaction network. The solid line represents the existing work verification, and the dash line represents the prediction. (C) The downstream genes of CEBPA. The blue arrow indicates inhibition.

