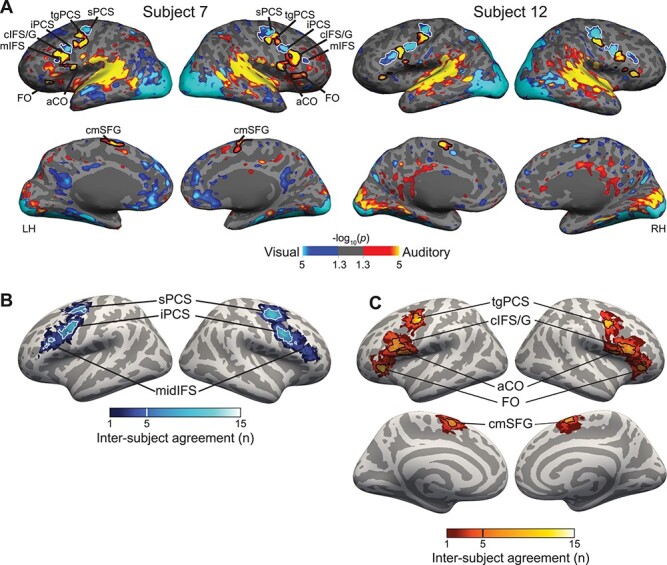
Figure 4 .

(A) Contrast of auditory 2-back (yellow) versus visual 2-back (blue) WM task activation in 2 representative subjects (all subjects are shown in Supplementary Fig. S2). In lateral frontal cortex, we observe 3 visual-biased structures: sPCS and iPCS and midIFS. They are interleaved with auditory-biased structures including the transverse gyrus intersecting precentral sulcus (tgPCS), cIFS/G, aCO, and FO. On the medial surface, we observe auditory-biased cmSFG. (B) Probabilistic overlap map of visual-biased ROI labels projected into fsaverage space. Although there is great variability in the exact positioning of these regions, they overlap into 3 clear “hot spots.” Thick outlines are drawn around vertices that are included in 5 or more subjects (33% of the participants); for right midIFS, thin outlines are drawn around vertices that are included in 3 or more subjects (20% of the participants). (C) Probabilistic overlap map of auditory-biased ROI labels projected into fsaverage space. Outlines are drawn around vertices that are included in 5 or more subjects (33% of the participants).
