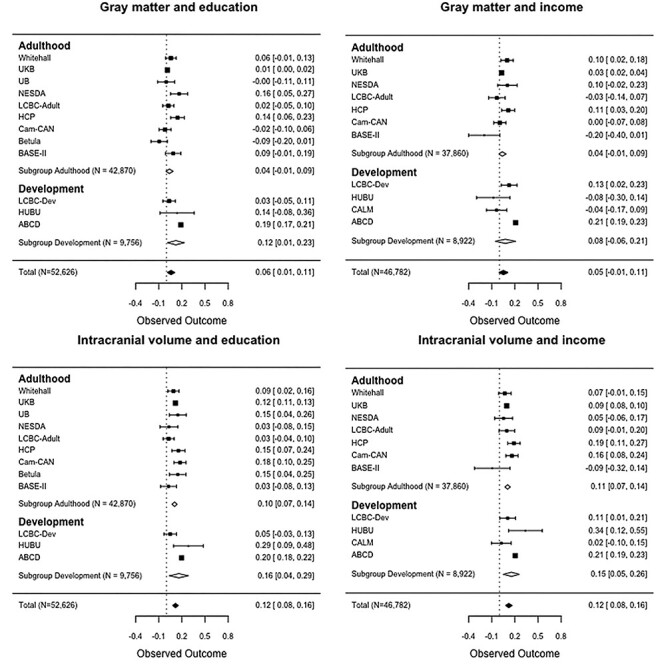
Figure 4 .

The associations of GM and ICV with education and income. Forest plots show the individual observed effect sizes with corresponding 95% CI. Diamonds represent the weighted average correlation estimate and its 95% CI with white diamonds representing the subgroup estimates and black diamonds the overall estimate. Numeric values of the cohort-specific and meta-analytic estimates are given in the right column.
