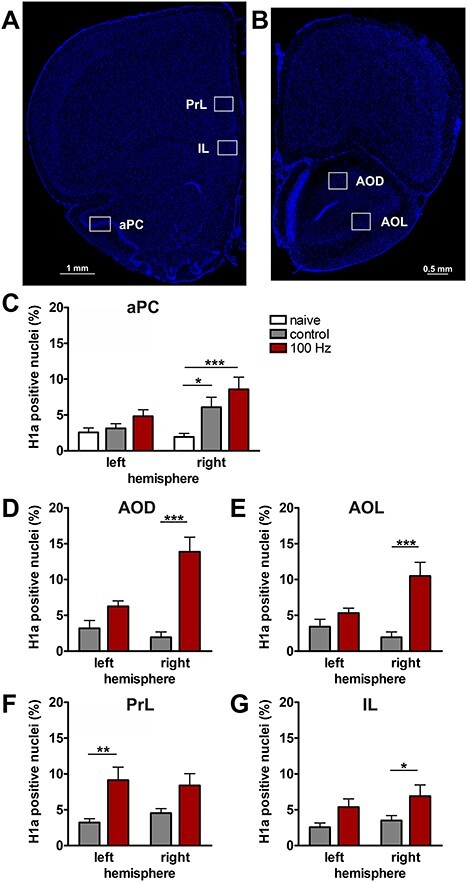
Figure 8 .

100 Hz stimulation of the olfactory bulb results in an increase in nuclear Homer1a mRNA expression in olfactory cortex and associated brain regions. (A, B) DAPI-stained coronal sections of a rat brain showing regions of interest (white rectangles) in one of the analyzed hemispheres. (A) Sections for prelimbic cortex (PrL), infralimbic cortex (IL), and anterior piriform cortex (aPC) were obtained between +3.0 and +3.5 mm anterior to bregma. (B) For the dorsal (AOD) and lateral (AOL) anterior olfactory nucleus, sections between +5.0 and +5.5 mm anterior to bregma were analyzed. (C–G) Plots showing the relative percentage of nuclear Homer1a (H1a) mRNA expression in (C) aPC, (D) AOD, (E) AOL, (F) PrL, and (G) IL in the left (unstimulated) and right (stimulated) hemispheres of naive (only aPC; white bars), test–pulse stimulated control (gray bars), and 100 Hz stimulated animals (red bars). (C) In the aPC, 100 Hz stimulation of the right OB results in an increase in Homer1a expression in the right aPC compared with the left aPC of all three groups (post hoc test: right 100 Hz: vs. left naive P < 0.01; vs. left control P < 0.01; vs. left 100 Hz P < 0.05) and the right aPC of the naive group (post hoc test: P < 0.001). Test–pulse stimulation of the right OB resulted in an increase in Homer1a mRNA expression in the right aPC (control) compared with the left and right hemisphere of the naive animals (post hoc test: right control: vs. left naive P < 0.05; vs. right naive P < 0.05). (D, E) In AOD and AOL, the right AOD and AOL exhibit a significant elevation of Homer1a expression following 100 Hz stimulation compared with the left AOD and AOL of the same group (post hoc test: AOD: P < 0.01; AOL: P < 0.05), as well as left and right AOD and AOL of the control group (AOD right 100 Hz: vs. right control P < 0.0001; vs. left control: P < 0.0001; AOL right 100 Hz: vs. right control P < 0.001; vs. left control: P < 0.01). (F) In the PrL, 100 Hz stimulation increases Homer1a mRNA expression in both hemispheres compared with the left PrL of control animals (post hoc test left control: vs. right 100 Hz P < 0.05; vs. left 100 Hz P < 0.01), and, also in the left hemisphere of stimulated animals compared with the right PrL of controls (post hoc test: P < 0.05). (G) By contrast, only the right IL shows a significantly higher percentage of Homer1a mRNA-positive neurons after 100 Hz stimulation in comparison to the left and right IL of the control group (post hoc test right 100 Hz: vs. left control P < 0.05; vs. right control P < 0.05). C–G: mean + SEM. Significant differences between naive, control, and test groups within either left or right hemisphere, revealed by post hoc analysis (Fisher’s LSD test), are marked with asterisks: *P < 0.05, **P < 0.01; ***P < 0.001.
