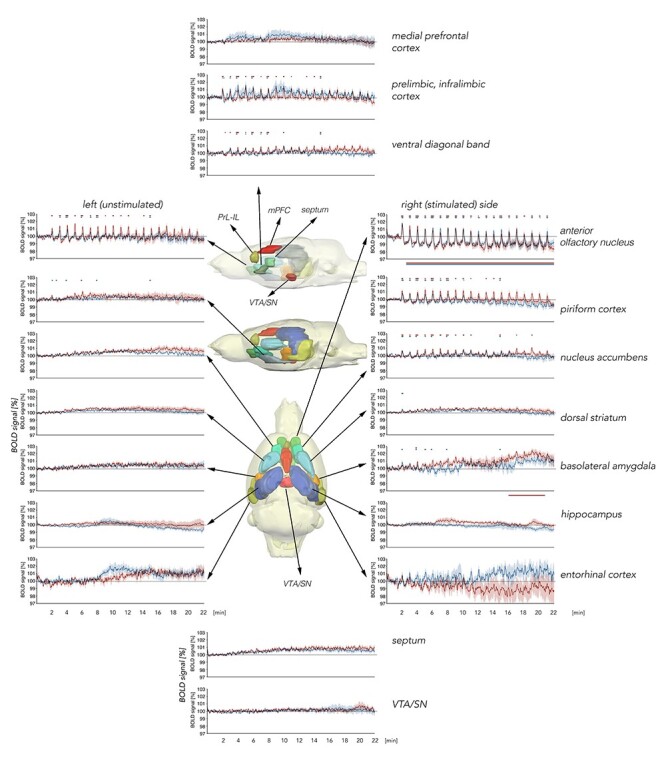
Figure 3 .

Summary of BOLD responses for VOI analysis over the course of patterned stimulation of the olfactory bulb. The brain schemata shown in the central section are lateral views from the left (unstimulated) hemisphere as well as a top view of a 3D standard rat brain containing all analyzed brain regions in different colors. The upper lateral brain diagram highlights all medial brain regions analyzed. The brain diagram below it shows a lateral view of other brain regions that were analyzed. These are also highlighted in the bottom “top view” brain diagram. The graphs represent volume of interest (VOI) analysis for BOLD time series in individual brain regions. BOLD time series for medial brain regions are shown in the graphs in the top and bottom central sections. Graphs depicting results from lateral brain regions are separated into right (stimulated) and left (unstimulated) hemispheres, for the recording time of 22 min during 20 trains of patterned stimulation at 100 Hz (red curves, n = 9) or at 20 Hz (blue curves, n = 9) of the olfactory bulb. Every significant change in BOLD signals is marked above each graph (red line: 100 Hz stimulation, blue line: 20 Hz stimulation). Significant BOLD responses from baseline are detectable in the anterior olfactory nucleus (AON), right/left piriform cortex, right nucleus accumbens, right basolateral amygdala, right dorsal striatum, the prelimbic–infralimbic cortex (PrL-IL), and ventral diagonal band of Broca. Significant shifts (decrease or increase) of baseline BOLD signals are marked below the graph (red line: 100 Hz stimulation; blue line: 20 Hz stimulation). A significant shift in baseline BOLD signals is visible for the right AON and right basolateral amygdala. VTA/SN: ventral tegmental area/substantia nigra, mPFC: dorsal medial prefrontal cortex. Mean BOLD time series ±SD.
