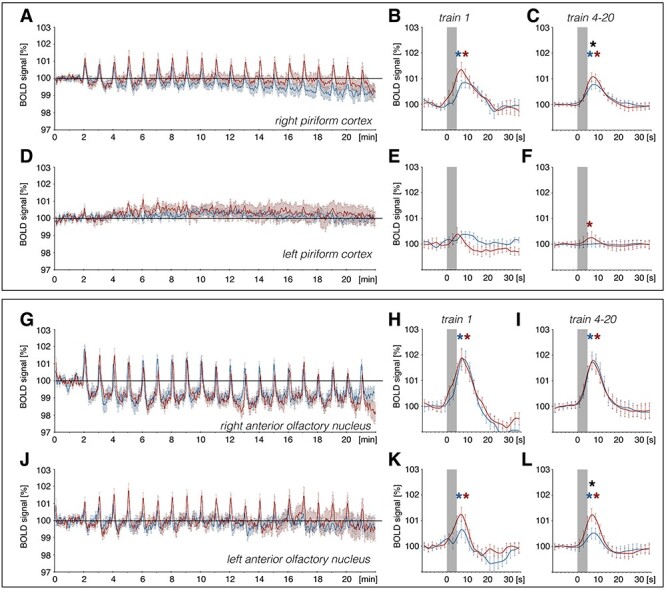
Figure 4 .

Patterned stimulation of the olfactory bulb induces a change in BOLD responses in the piriform cortex and anterior olfactory nucleus. VOI analysis of BOLD responses in the piriform cortex and anterior olfactory nucleus (AON) for the right (stimulated) and left (unstimulated) hemisphere during 100 Hz (red curve) and 20 Hz stimulation (blue curve) of the olfactory bulb (OB). (A, D, G, J): Enlarged image of piriform cortex and AON from Fig. 2. (A–F): BOLD time series of the (A) right and (D) left piriform cortex showing changes in BOLD signals over the time course of fMRI imaging. A significant BOLD response can be detected for train 1 and train 4–20 in the right piriform cortex and for trains 4–20 for 100 Hz stimulation in the left piriform cortex. No significant difference in evoked BOLD response between stimulation protocols can be detected for the first train (train 1) in the (B) right and (E) left piriform cortex. The mean of BOLD responses for trains 4–20 reveal a significantly stronger effect of 100 Hz stimulation on BOLD signals in the (C) right piriform cortex when compared with 20 Hz stimulation of the OB. (G–L): BOLD time series for the (G) right and (J) left AON depicting strong changes in BOLD responses as well as a decrease in baseline BOLD responses in the right AON. A significant BOLD response for both protocols (train 1 and trains 4–20) can be detected in the left and right AON. No significant difference in evoked BOLD response between stimulation protocols can be detected for train 1 in the (H) right and (K) left AON. For trains 4–20, mean BOLD responses in the (I) right AON do not differ between both stimulation protocols, whereas in the (L) left AON, trains 4–20 show a significant stronger BOLD response for 100 Hz stimulation compared with 20 Hz stimulation of the OB. Significant difference between stimulation protocols are marked with a black asterisk (*), whereas significant BOLD responses induced by 100 Hz or 20 Hz stimulations are indicated with a red or blue asterisk, respectively. The gray box indicates the stimulation period.
