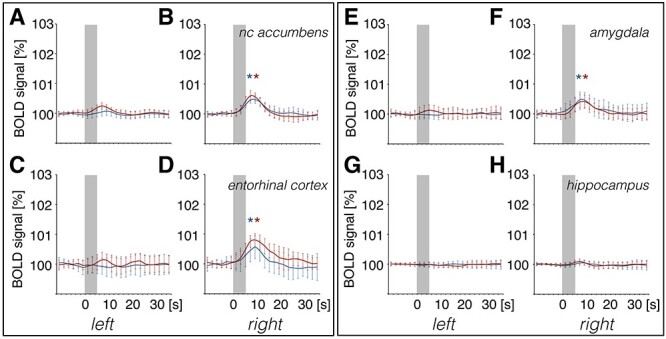
Figure 5 .

Patterned stimulation of the olfactory bulb results in strong changes in BOLD signals in brain regions of the right (stimulated) and less pronounced changes in the left hemisphere. Summary of mean (±SD) BOLD responses of trains 4–20 determined by volume of interest (VOI) analysis for patterned stimulation of the olfactory bulb at 100 Hz (red curve) and at 20 Hz (blue curve). A significant BOLD response was detected in (B), the right nucleus accumbens, (D), the right entorhinal cortex, and (F), the right basolateral amygdala. The corresponding left hemispheres of (A) the nucleus accumbens, (C) entorhinal cortex, and (E) amygdala were unaffected. No change in BOLD responses was detected in either the left (G) or right (H) hippocampus. BOLD responses for each train were normalized to exclude effects due to baseline shifts. Gray boxes indicate the stimulation periods. Significant BOLD responses induced by 100 Hz or 20 Hz are indicated with a red or blue asterisk, respectively.
