Figure 6 .

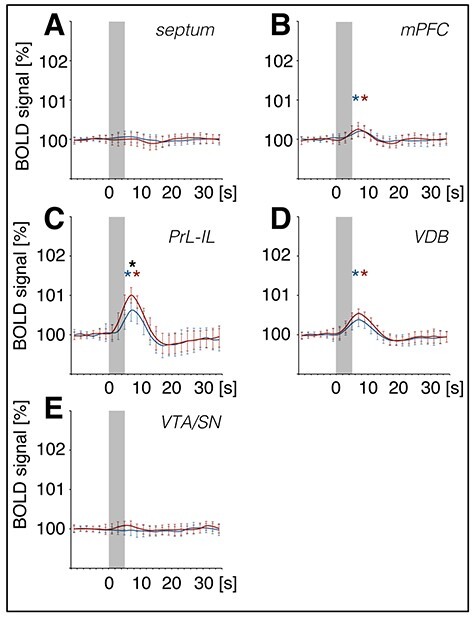
BOLD signals in the prelimbic–infralimbic cortex and ventral diagonal band of Broca increase during patterned stimulation of the olfactory bulb. Summary of mean (±SD) BOLD responses for trains 4–20, as determined by volume of interest (VOI) analysis for medial brain regions: (A) Septum, (B) dorsal medial prefrontal cortex (mPFC), (C) prelimbic–infralimbic cortex (PrL-IL), (D) ventral diagonal band of Broca (VDB), and (E) ventral tegmental area–substantia nigra (VTA/SN). Patterned stimulation of the olfactory bulb was applied at 100 Hz (red curve) and at 20 Hz (blue curve). BOLD signals increased in the mPFC, PrL-IL, and VDB. BOLD responses for each train were normalized to exclude effects due to baseline shifts. Gray boxes indicate the stimulation period. A significant difference between stimulation protocols is marked with a black asterisk (*) and significant BOLD responses with a red (100 Hz protocol) or blue (20 Hz protocol) asterisk.
