
Figure 4 .
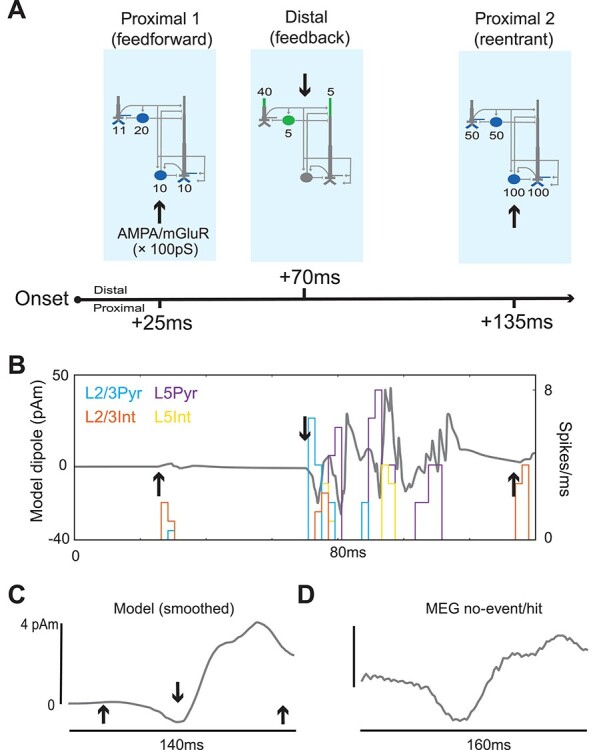
The SI model qualitatively reproduces the MEG-measured SI no-event/hit-evoked response. (A) Schematic of the feedforward/feedback exogenous input sequence reproducing the somatosensory-evoked response. Sites of proximal glutamatergic “feedforward” input are shown in blue and sites of distal “feedback” inputs in green. Pyramidal cells have three proximal sites (two on the basal dendrites, one on the oblique dendrite), each with the weight indicated here. (B) Spike histograms and raw sensory-evoked response from the model at rest (i.e., without a prestimulus beta event), arrows same as in (A). (C) The same model-evoked response after smoothing by convolving with a 45 ms Hamming window. (D) MEG-evoked response averaged over all hit trials without a prestimulus beta event.