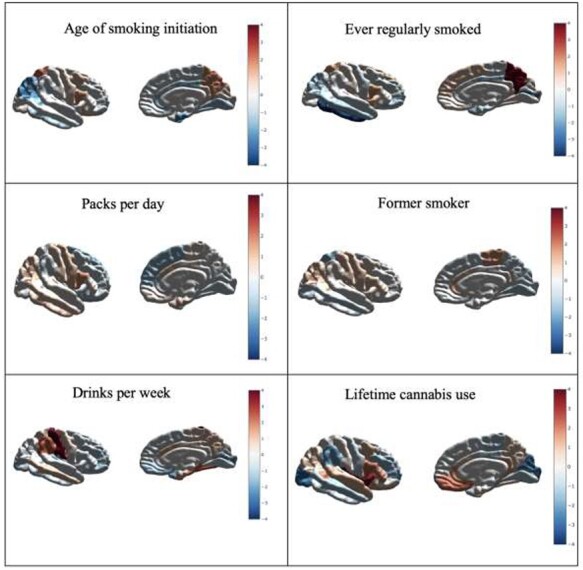
Figure 1 .

Standardized effect sizes (z-scores) reflecting the relationship between genetic risk for the substance use phenotypes and surface area. Positive effects highlighted in red denote increases in surface area and negative effects highlighted in blue denote reductions in surface area for colored regions. Results shown here correspond to all observed genetic correlations regardless of their level of statistical significance. Details for genetic correlations which surpassed multiple testing correction are shown in Table 2.
