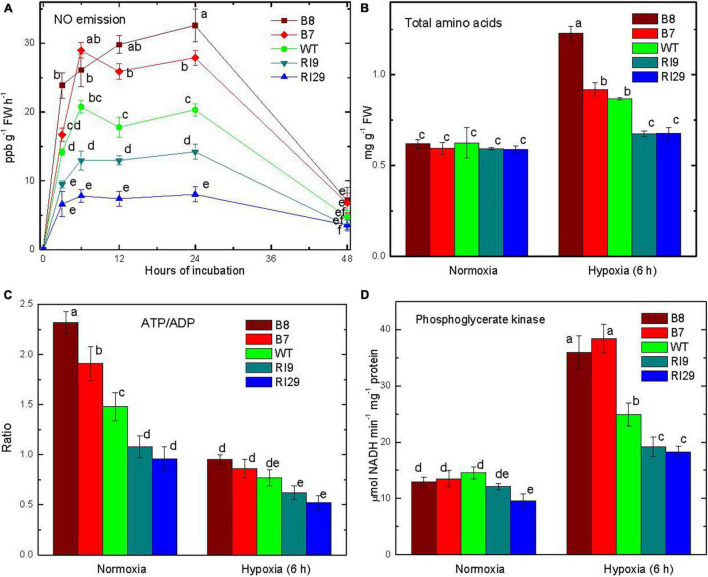
FIGURE 1.
Leaf nitric oxide emission (A), total amino acid content (B), ATP/ADP ratio (C), and phosphoglycerate kinase activity (D) in tobacco plants with differing amounts of alternative oxidase, and exposed to hypoxia (at time 0 in A). The plant lines used included wild type (WT), two alternative oxidase overexpressors (B7, B8), and two alternative oxidase knockdowns (RI9, RI29). Vertical bars indicate SD from three to four independent experiments (n = 3–4); different letters indicate significant differences between five tobacco lines and the time points.

