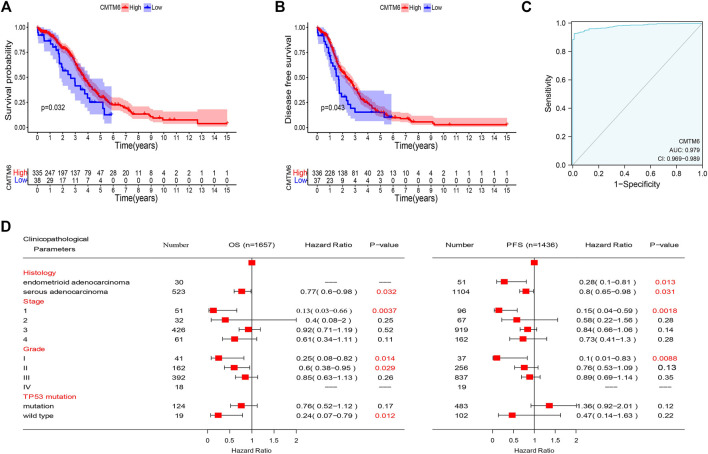
FIGURE 3.
Prognostic value of CMTM6 expression and ROC analysis. (A,B) Survival analysis of CMTM6 in OV showed that high CMTM6 expression has an increased OS and DFS based on TCGA database. (C) ROC curve indicated the better performance of survival prediction. (D) Forest plot showed the correlation between CMTM6 expression and clinicopathological parameters in OV patients.

