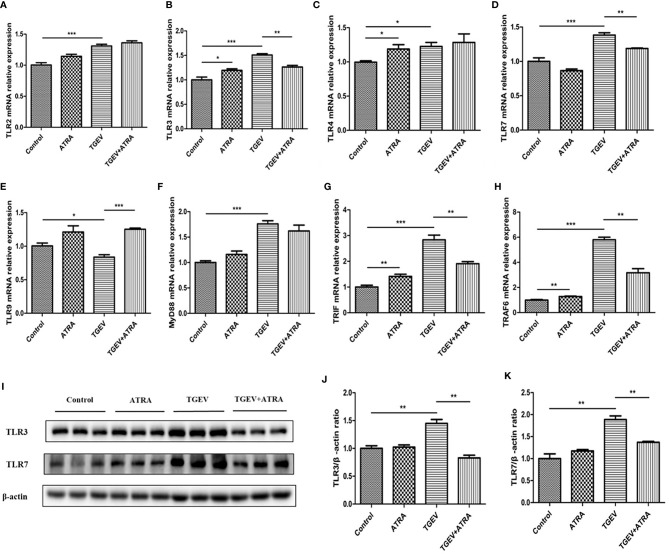
Figure 7.
Effects of ATRA and TGEV on TLRs signaling pathway in IPEC-J2 cells. The cells were mock-infected or infected with TGEV (1 MOI) for 1 h, followed by incubation with or without 80 μM ATRA for 36 h. (A–H) Total RNA was extracted from cells and the mRNA abundance of TLR2, TLR3, TLR4, TLR7, TLR9, MyD88, TRIF and TRAF6 were analyzed by real‐time PCR. Data are presented as means ± SEM (n = 4). *P < 0.05, **P < 0.01 and ***P < 0.001. (I–K) Western blot and densitometric analysis of TLR3 and TLR7. Data are presented as means ± SEM (n = 3). **P < 0.01.

