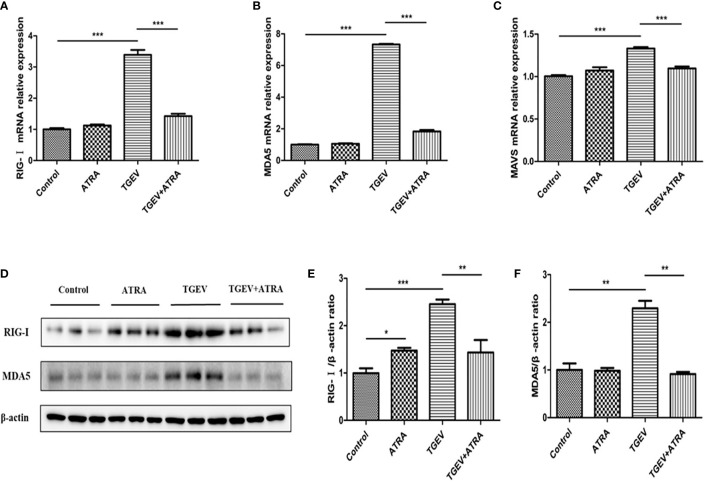
Figure 8.
Effects of ATRA and TGEV on RLRs signaling pathway in IPEC-J2 cells. The cells were mock-infected or infected with TGEV (1 MOI) for 1 h, followed by incubation with or without 80 μM ATRA for 36 h. (A–C) Total RNA was extracted from cells and the mRNA abundance of RIG-Ⅰ, MDA5 and MAVS were analyzed by real‐time PCR. Data are presented as means ± SEM (n = 4). ***P < 0.001. (D–F) Western blot and densitometric analysis of RIG-I and MDA5. Data are presented as means ± SEM (n = 3). *P < 0.05, **P < 0.01 and ***P < 0.001.

