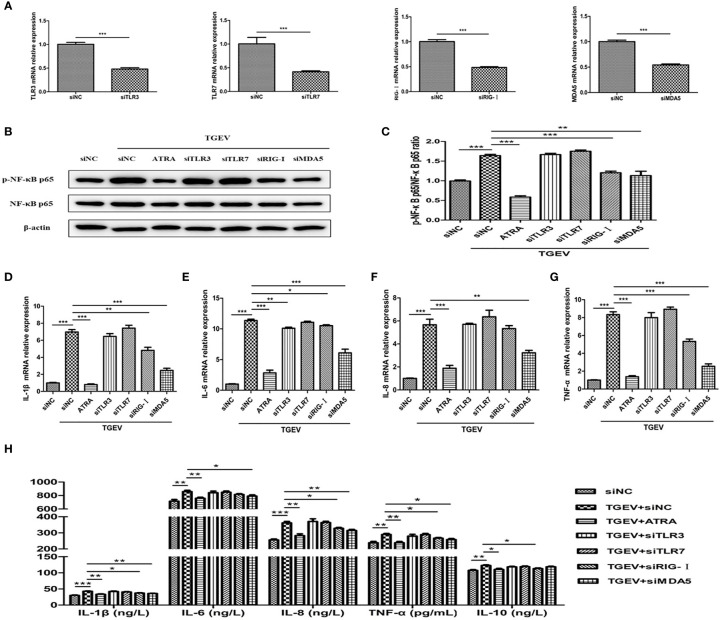
Figure 9.
ATRA attenuated TGEV-induced inflammatory response in IPEC-J2 cells via suppressing the RLRs/NF‐κB signaling pathway. (A) The cells were transfected with 100 nM specific siRNAs targeting TLR3, TLR7, RIG-I or MDA5, or negative control siRNA (siNC) for 24 h, then cells were collected and the mRNA abundance of TLR3, TLR7, RIG-I and MDA5 were analyzed by real‐time PCR. (B–G) The cells were transfected with 100 nM specific siRNAs targeting TLR3, TLR7, RIG-I or MDA5, or negative control siRNA (siNC) for 24 h followed by mock-infection or infection with TGEV (1 MOI) for 1 h, and then incubation with or without 80 μM ATRA for 36 h. (B, C) The phosphorylation level of NF-κB was analyzed by western blot. Data are presented as means ± SEM (n = 3). **P < 0.01 and ***P < 0.001. (D–G) the mRNA abundance of IL‐1β, IL‐6, IL‐8 and TNF‐α were analyzed by real‐time PCR. Data are presented as means ± SEM (n = 4). *P < 0.05, **P < 0.01 and ***P < 0.001. (H) The concentrations of IL‐1β, IL‐6, IL‐8, TNF‐α and IL-10 in IPEC-J2 cells culture medium were measured by ELISA. Data are presented as means ± SEM (n = 4). *P < 0.05, **P < 0.01 and ***P < 0.001.

