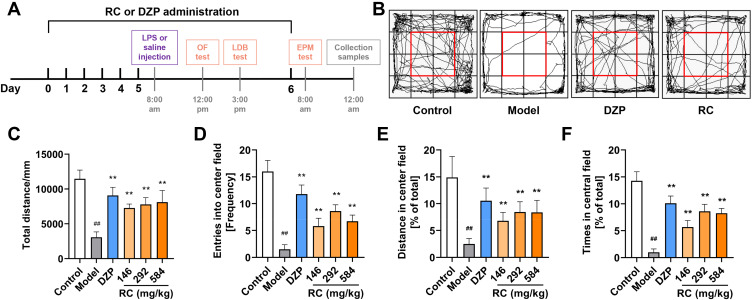
Figure 5.
OF test results showing the effect of RC extract on the behaviors of LPS-induced anxiety mice. (A) Schematic diagram of the experimental process; (B) Representative movement traces (black lines) for control, model, DZP, and RC group mice in OF. Red rectangle marks the central field (25% of total area); (C) Total distance covered by mice; (D) Frequency of entering the central field; (E) Distance traveled in the central field; (F) Percentage of time mice spent in the central field. Data are from n=10 mice per group. Mean±SD plotted (Control vs Model, ##p<0.01; Model vs DZP or RC, **p<0.01).

