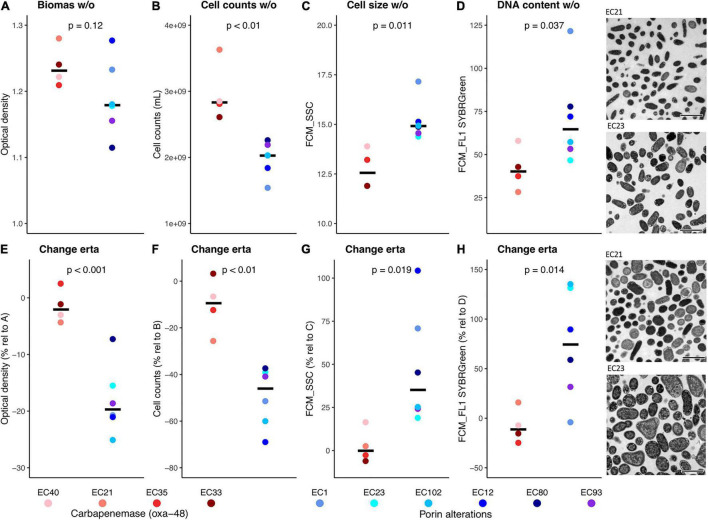
FIGURE 2.
Results of basic growth parameters of strains of the two groups determined during steady-state growth in continuous culture are shown. The upper row (panels A–D) displays results during growth without carbapenem (w/o). (A) biomass (OD measurements), (B) cell concentrations [based on flow cytometric measurements (FCM)], (C) relative cell size (based on FCM sideward scatter signals; values of EC21 and EC33 are very similar and undistinguishable on the plot), (D) relative DNA content (based on FCM green fluorescence signals). The lower row (panels E–H) displays results during growth with sublethal concentrations of carbapenem (0.5 mg L–1 ertapenem; erta) relative to growth without the antibiotic. Results of statistical testing (Student’s t-test) between groups are indicated. Transmission electron microscopy pictures of representative strains of each group during growth in both conditions (+/− ertapenem) are shown on the right. The scale bar represents 2 μm.

