
FIGURE 3.
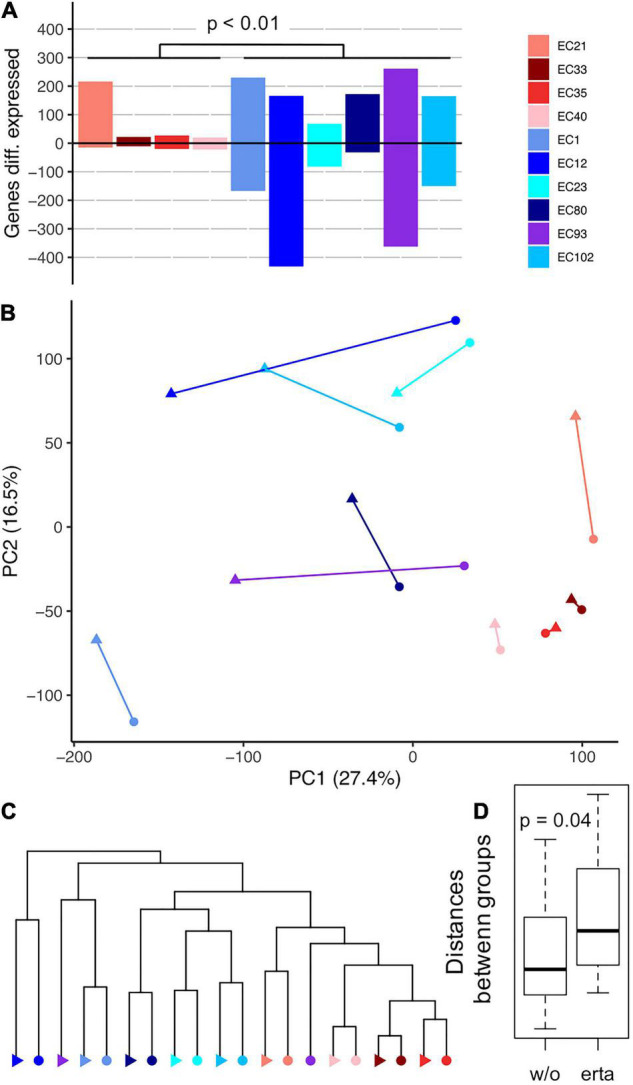
Gene expression results of strains grown in continuous culture in steady-state (+/− ertapenem) are shown. Panel (A) displays amount of differentially expressed genes of individual strains during growth with the antibiotic compared with growth without ertapenem. All genes that showed a TPM >10 and a fold change >1 were considered; the p-value (Student’s t-test) refers to amount of differentially expressed genes between the two groups. A principal component analysis based on expression patterns of shared genes is shown in panel (B) and results of hierarchical clustering are shown in panel (C) (circles and triangles represent results from growth with and without ertapenem, respectively). Euclidean distances of all pair-wise comparisons between strains of individual groups (−/+ ertapenem; w/o/erta) is shown in panel (D) (p-value was based on Student’s t-test result).