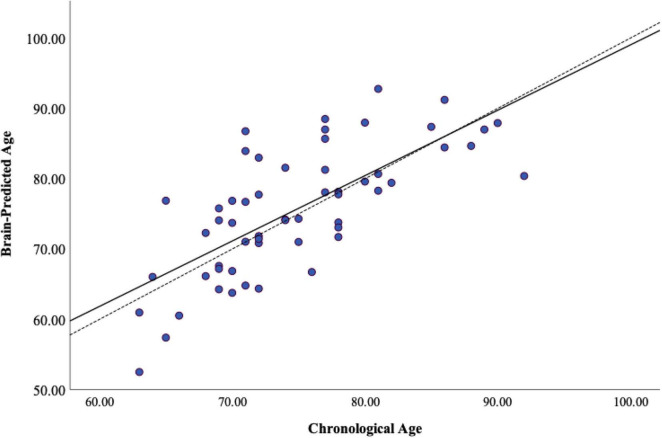
FIGURE 2.
Heterogeneity of brain-predicted age. Brain-predicted age from brainageR regression model. Scatterplot depicting chronological age (x-axis) by brain-predicted age (y-axis). Dashed line is the line of identity and solid black line is the regression line of chronological age on brain-predicted age.

