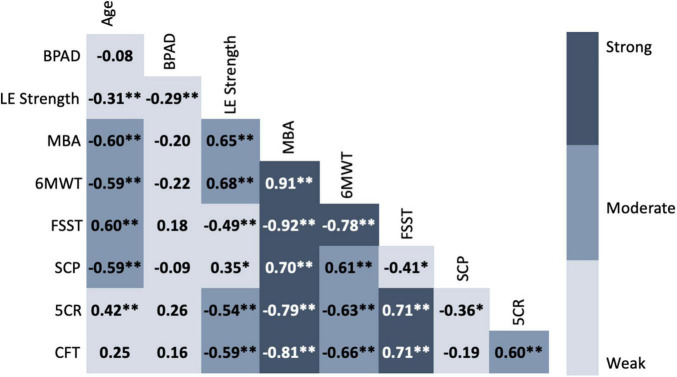
FIGURE 3.
Correlation matrix of chronological age, brain-predicted age difference, normalized leg strength and functional performance. Values represent Pearson’s r for each bivariate correlation. Weak = 0.00–0.49, Moderate = 0.50–0.69, Strong = 0.70–1.0 (Jurs et al., 1998). BPAD, brain-predicted age difference; LE, lower extremity; MBA, mobility battery assessment; 6MWT, six-minute walk test; FSST, four square step test; SCP, stair climb power; 5CR, five times chair rise; CFT, complex functional task.

