FIGURE 3.
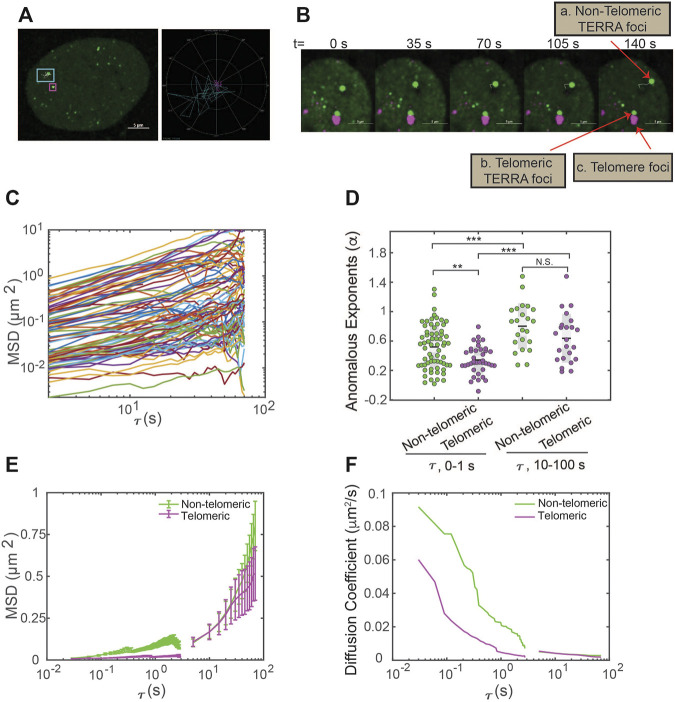
Single-particle tracking of TERRA foci mobility in live cells. (A) Left, U2OS cells expressing dCas13b-SunTag-sfGFP with an overlay of representative TERRA foci tracks. Right, trajectories of the TERRA foci highlight the areas explored by the two selected TERRA foci in the left image. (B) Time-series images showing a representative TERRA focus (a) that is not localized to telomeres (called non-telomeric) and a TERRA focus (b) whose motions are in tandem with the neighboring telomere foci (c) and so is taken to be colocalized with the telomere (called telomeric). (C) Representative Mean Square Displacement (MSD) trajectories plotted versus lag time (τ) on log-log coordinates for TERRA foci. Each line represents one TERRA track. (D) The anomalous exponents evaluated from the MSD plots on two timescales 0–1 s and 10–100 s for telomeric and non-telomeric TERRA foci, each dot represents one TERRA track. *p < 0.05, **p < 0.01, and ***p < 0.001. (E) MSDs averaged at each τ for telomeric and non-telomeric TERRA foci. (F) Time-dependent diffusion coefficients evaluated from the average MSD plots for telomeric and non-telomeric TERRA foci over lag time τ.

