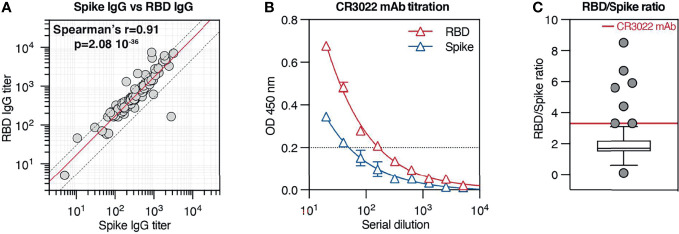
Figure 5.
Spike IgG antibodies generated after natural COVID-19 infection are not polarized toward the receptor-binding domain (RBD) region. (A) Correlation between Spike IgG titer and RBD IgG titers across all patients from our cohort. The red solid line indicates the mean RBD/Spike titer ratio (1.7), while the two dotted lines indicate the SD ( ± 1.2). (B) Spike and RBD IgG titration (mean ± SD) by ELISA across 9 serial dilutions of the anti-RBD monoclonal Ab CR3022. (C) Ratio between RBD and Spike IgG titers across all patients in the cohort. Results are in box-and-whiskers plot (Tukey) indicating cohort distribution (right panel, only individual data outside from the whiskers are displayed with a symbol). The red line indicates the RBD/Spike titer ratio relative to CR3022 mAb (3.3).

