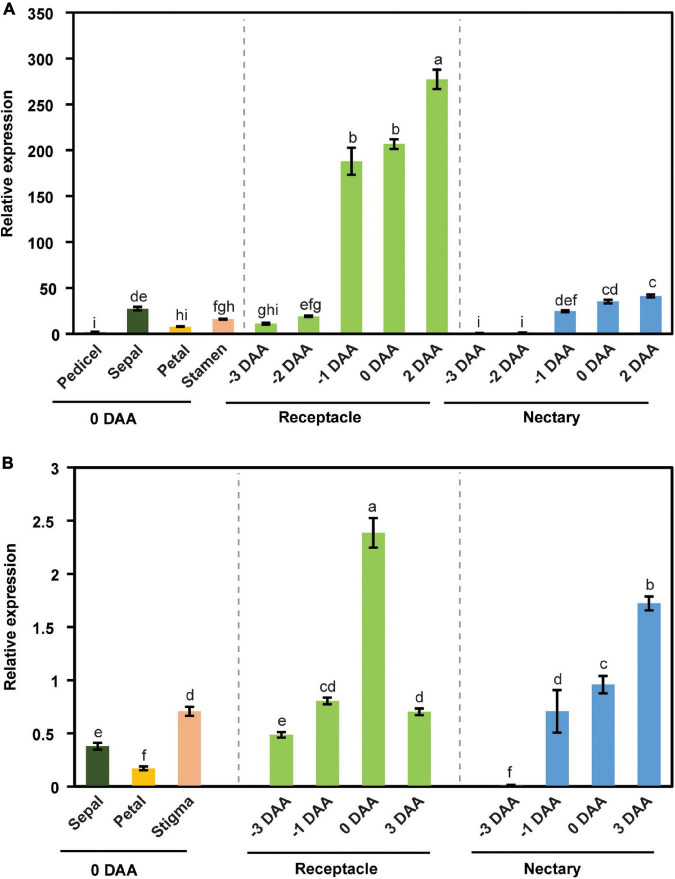
FIGURE 2.
The expression pattern of CsSWEET7a in male (A) and female flowers (B). DAA, days after anthesis; −3, −2, −1 DAA, being 3, 2, and 1 day(s) before anthesis, respectively; 0 DAA, the day of anthesis; and 2 and 3 DAA, being 2 and 3 days after anthesis, respectively. Mean values ± SE of three independent biological replicates were shown. Statistical analyses were performed using one-way ANOVA followed by multiple comparisons using Fisher’s LSD method (P-value < 0.05).

