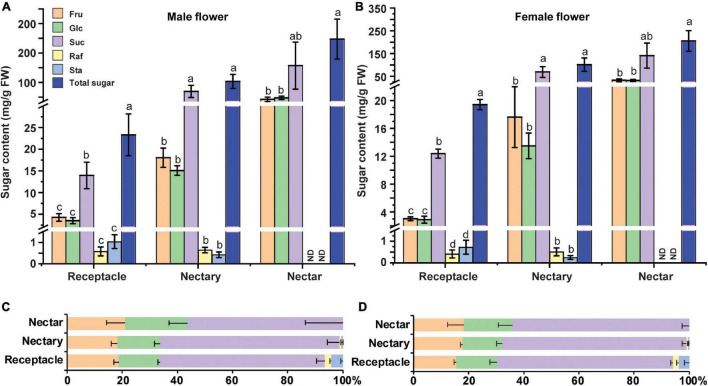
FIGURE 5.
Sugar content in male and female cucumber flowers at anthesis. Sugar content (A,B) and sugar distribution (%) (C,D) in receptacle, nectary, and nectar of male (A,C) and female flowers (B,D) at anthesis. Fru, fructose; Glc, glucose; Suc, sucrose; Raf, raffinose; Sta, stachyose; FW, fresh weight. ND, not detected. For each sample in this figure, ten flowers were collected and combined as a sample. Mean values ± SE of three independent biological replicates were shown. Statistical analyses were performed using one-way ANOVA followed by multiple comparisons using the Fisher’s LSD method (P-value < 0.05) in each tissue.

