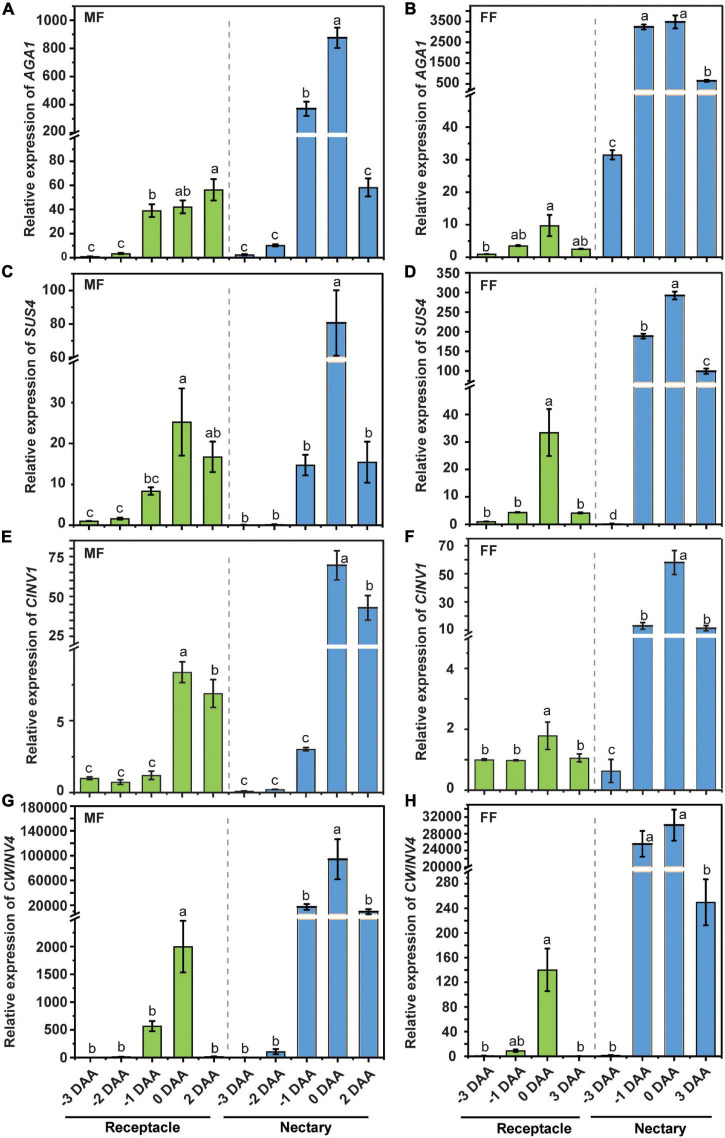
FIGURE 6.
The expression pattern of sugar metabolism enzymes in cucumber receptacle and nectary. The relative expression level of cucumber AGA1, SUS4, CINV1, and CWINV4 in male (A,C,E,G) and female flowers (B,D,F,H). DAA, days after anthesis; −3, −2, −1 DAA, being 3, 2, and 1 day(s) before anthesis, respectively; 0 DAA, the day of anthesis; and 2 and 3 DAA, being 2 and 3 days after anthesis, respectively. Mean values ± SE of three independent biological replicates were shown. Statistical analyses were performed using one-way ANOVA followed by multiple comparisons using the Fisher’s LSD method (P-value < 0.05) in each tissue. Gene IDs: AGA1 (Csa4G631570), alkaline a-galactosidase 1; SUS4 (Csa5G322500), sucrose synthase 4; CINV1 (Csa5G615240), cytosol invertase 1; CWINV4 (Csa2G351670), cell wall invertase 4.

