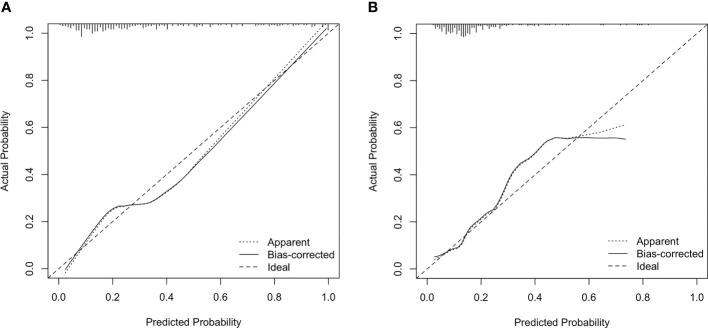
Figure 7.
Calibration plot for internal validation of the Luminal subtypes (A) and triple-negative subtype (B). The x-axis is the nomogram-predicted probability of genotypes. The y-axis is the actual probability. The dotted line represents an ideal standard curve; the solid line represents the prediction calibration curve of the nomogram. The solid line has a closer fit to the ideal dotted line, which indicates better predictive accuracy of the nomogram (p = 0.22, 0.74).

