
Figure 3.
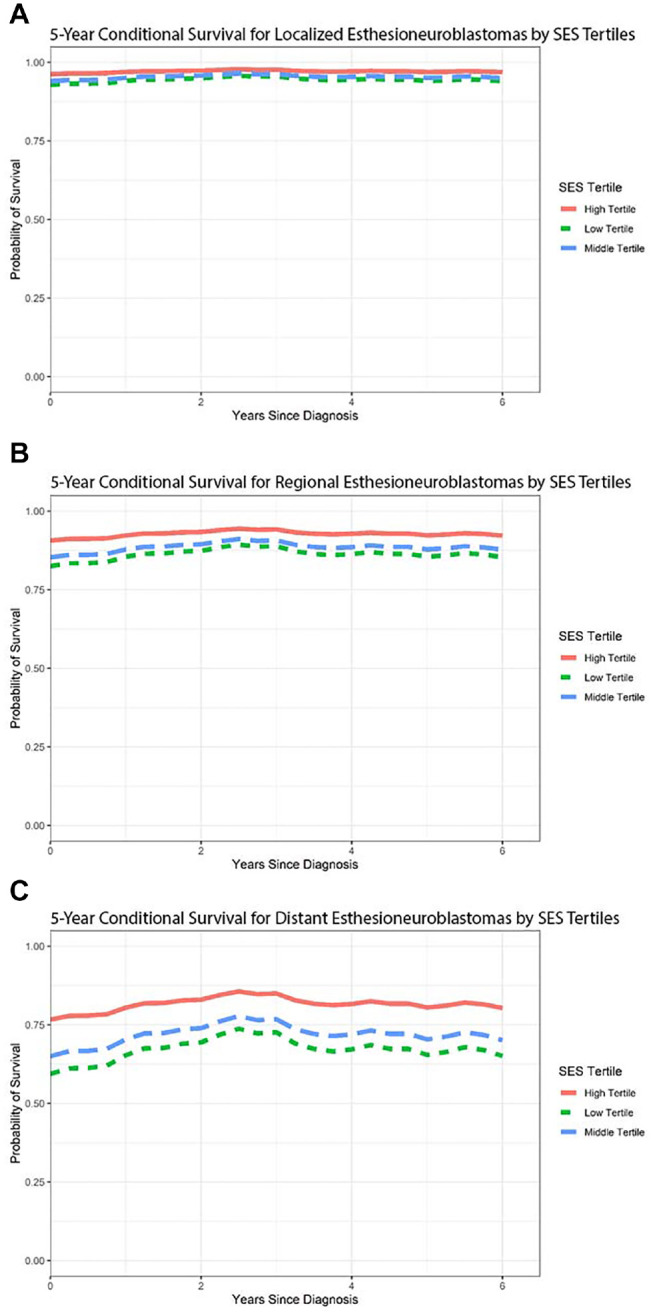
Conditional survival graphs predicting disease-specific survival of (a) localized, (b) regional, and (c) distant esthesioneuroblastoma, stratified by socioeconomic status (SES) tertiles.
Official websites use .gov
A
.gov website belongs to an official
government organization in the United States.
Secure .gov websites use HTTPS
A lock (
) or https:// means you've safely
connected to the .gov website. Share sensitive
information only on official, secure websites.
Conditional survival graphs predicting disease-specific survival of (a) localized, (b) regional, and (c) distant esthesioneuroblastoma, stratified by socioeconomic status (SES) tertiles.