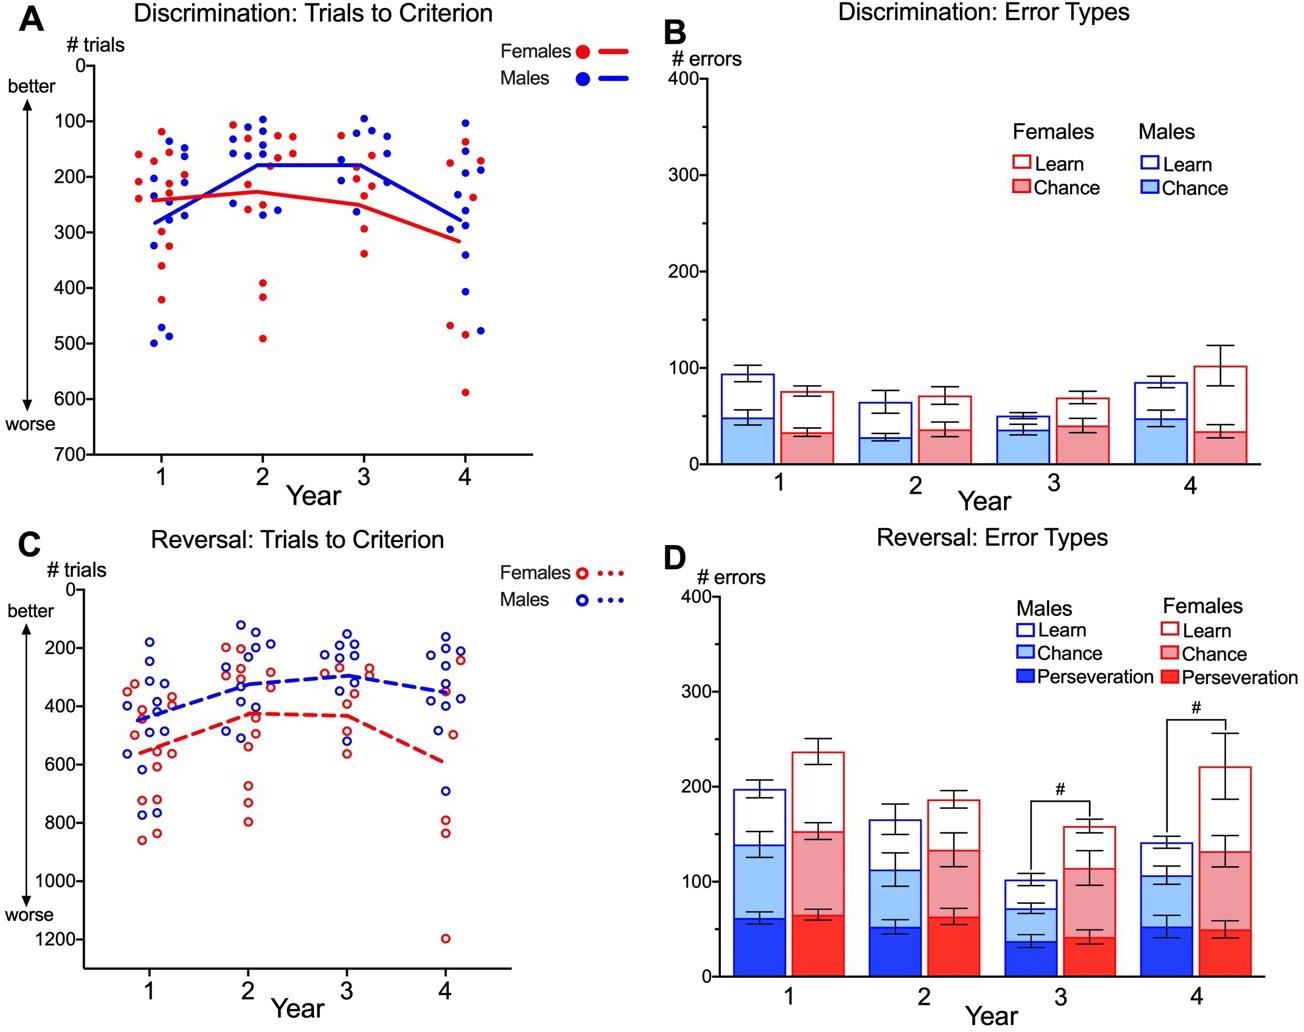
Figure 2. Sex differences in cognitive aging trajectories in marmosets.

Trials to criterion for each year of testing for males (blue) and females (red) on discrimination (A&B) and reversal (C&D). Points represent averaged scores for individual marmosets within each year. Lines represent average aging trajectories from multilevel growth models reported in Table A.5. Error types for discrimination (B) and reversal (D) are presented as means and SEM. #p < 0.065. Y-axes are inverted for A & C for readability.
